
Written by Ben Griffis
Background and Motivation
Pass completion percentages are, of course, widely used. It’s a simple way to quickly see how frequently a player completes a pass. We would expect a player with a 90% pass completion percent to complete 9 out of 10 passes, on average. And the flip side of that is that the player they pass to should successfully receive 9 out of 10 passes.
The issue with standard pass completion percentages is that there is so much context that we need in order to properly evaluate whether one player might be better at completing passes than another, or rather if one player can create the best opportunity for their receiver to receive the ball. There are extremes, like a Center Back’s completion % compared to an Attacking Midfielder’s, that we know will be different.
But then we also have within-position contexts that need to be considered. Take a player playing as a double pivot, for instance. One role this player can occupy is a Gennaro Gattuso role: disrupting the opposition, winning the ball back before laying off a relatively simple (and high completion rate) pass to another player. Another role this player can occupy is an Andrea Pirlo role: the architect, the orchestrater, the player who the entire team depends on for moving the ball around the pitch and creating plays. We should expect Gattuso to have a slightly higher completion % than Pirlo, given that they are tasked with performing vastly different passing duties.
Thus, we can see that even comparing completion rates within a position can have some nuance making it difficult to determine who might be better at completing the passes they’re asked to complete or which player creates the highest chance of their target receiving a pass successfully. Obviously, we know Pirlo is one of the best passers the game has ever seen, and I’m not trying to claim otherwise.
But we need something else, outside of simple completion percentages, that will allow us to compare different players and take out some of that noise (more on this at the end of this article). Something that allows us to see which players might be better at completing passes or creating the best chance for their receiver than others.
The Idea Behind the Added Receiving Rate
One way I think we can address this is by calculating what I’ll term, “added receiving rate” (or ARR). The theory behind this is straightforward.
To see how well a player can create the best receiving chances for their receiver with their passes, we should isolate that player’s passes to a certain receiver and compare their completion % to that receiver against the aggregate completion % to that receiver of all other players. So, instead of the focal point being the passing player, we’re shifting it to look at the receiving player.
ARR attempts to determine the overall receiving rate added (or subtracted) from their teammates.
Statistically speaking, isolating the passes from one player to another and comparing them to that receiver’s average, excluding our focal passer, is on the lines of a quasi-experiment. We have our treatment (the focal player & receiver) and the control (all other players & that same receiver).
By iterating this process for every player on a team and averaging each player’s ARR out, our “experiment” will tell us whose passes give their receivers a better (or worse) chance to get the ball under control.
The Method and Code
Before we get too far into the exact method, I need to say that I used StatsBomb data. They have an extensive set of freely available data, and importantly, note the pass recipient for all passes. This data is very useful for everything from research and model development to visualization and even learning to code.
So, let’s begin. We only want to consider open-play passes. Considering passes like goal kicks or kickoffs will not give an accurate picture of a player’s ARR. I will also include my Python code here. I’m not an expert, so there are more efficient ways of doing everything, but oh well. This code does the job, and the code here is not the main part of this article, but I include it so you can recreate and experiment with this yourself.
(Click Here to view this code on my GitHub)
import pandas as pd

# Load our dataset. For this example code, I'll be using StatsBomb's 21/22 Indian Super League
df = pd.read_csv('ISL 21-22.csv')

# This will filter the data to only show  open-play passes
df = df[(df['type_name']=='Pass') & (df['sub_type_name'].isna())].reset_index(drop=True)
The next step is to generate all passing combinations in the league. If a player attempted a pass to another player at all during the season, that pairing gets an entry. One row per passer-receiver pairing. In the example code here I use StatsBomb’s 2021/22 Indian Super League data, and the top passing combination was from Mumbai City’s midfielder Ahmed Jahouh to another midfielder, Cássio Gabriel (149 attempts, 119 completions).
# Get a list of all players in the league
players = df.player_name.unique().tolist()

# Create a blank df we will populate with all the passing connections
connection_df = pd.DataFrame(columns=['pass_recipient_name', 'passes', 'passer', 'completions'])

# Iterate the creation of our full connection_df
for i in range(len(players)):
    # create a new df with just one focal player
    df1 = df[df['player_name']==players[i]]

    # count up all that focal player's receivers & make it a pandas df
    a = df1.groupby(['pass_recipient_name'])['pass_recipient_name'].count()
    a = pd.DataFrame(a)
    a = a.rename(columns={"pass_recipient_name": "passes"}).reset_index()

    # make sure we add in our focal player's name!
    a['passer'] = players[i]

    # now we sum up their total completions by receiver
    df1['completions'] = df1.outcome_name.isnull().groupby(df1['pass_recipient_name']).transform('sum')
    b = df1.groupby(['pass_recipient_name'])['completions'].mean().astype(int)
    b = pd.DataFrame(b)
    b = b.rename(columns={"pass_recipient_name": "completions"}).reset_index()

    # and finally, we merge our pass attempts and completions & add that receiver to the connection_df
    c = a.merge(b)
    connection_df = connection_df.append(c)

# Clean up the index and calculate the completion % for each passer-receiver pair
connection_df.reset_index(drop=True, inplace=True)
connection_df['completion_pct'] = connection_df['completions'] / connection_df['passes']
The next step includes a small subjective element. We need to determine a minimum number of passes that we’ll accept as a passing connection we use in our sample. I have chosen 10 passes, as I believe if one player passes to another player at least 10 times in a season, we have at least some decent evidence into that passer’s ability to create good, bad, or average receiving chances for that player.
10 passes are also not too restrictive in filtering out a lot of pass pairings. In fact, in the 21/22 Indian Super League (ISL), 10 passes from one player to another is actually the 59th percentile. While we are filtering out more than half of the total pass connections, having fewer than 10 passes may open us up to some major variance problems.
# Fliter out connections with fewer than 10 passes
connection_df = connection_df[connection_df['passes']>=10].reset_index(drop=True)

# Create a blank df we'll use as the base of our ARR data
testing_df = pd.DataFrame(columns=['pass_recipient_name', 'exclusion', 'mean_completion_pct'])

# Create lists with the unique passers and receivers
all_recipients = connection_df.pass_recipient_name.unique().tolist()
all_passers = connection_df.passer.unique().tolist()

# This is where I KNOW I could make the code more efficient...
# Iterate through every single unique recevier to show their receiving % from all passers ('None') and the focal passer (deemed 'exclusion')
for i in range(len(all_recipients)):

    # this first for loop creates their total pass received %
    focal_p = all_recipients[i]
    focaldf = connection_df[connection_df['pass_recipient_name']==focal_p]
    mu = focaldf.completions.sum()/focaldf.passes.sum()
    ex = 'None'
    row = pd.DataFrame({'pass_recipient_name':[focal_p], 'exclusion':[ex], 'mean_completion_pct':[mu]})
    testing_df = testing_df.append(row)

    for j in range(len(all_passers)):

        # this for loop creates their pass received % EXCLUDING each player
        # I hnow this part could be more efficient since it also excludes players not on the same team....... oh well! We'll filter those out later
        ex2 = all_passers[j]
        focaldf2 = connection_df[(connection_df['pass_recipient_name']==focal_p) & (connection_df['passer']!=ex2)]

        # this try/except basically says, if there is just one player our receiver has a connection with, we don't want an error so mu = their completion %
        try:
            mu2 = focaldf2.completions.sum()/focaldf2.passes.sum()
        except:
            m2 = focaldf2.completion_pct.mean()
        row2 = pd.DataFrame({'pass_recipient_name':[focal_p], 'exclusion':[ex2], 'mean_completion_pct':[mu2]})
        testing_df = testing_df.append(row2)
The next step is to calculate each receiver’s receiving % (and thus passer’s completion %) overall and also with one player excluded. The player exclusion is the first step of the principal component of the ARR.
testing_df = testing_df.reset_index(drop=True)

# Create a column to note the excluded player's difference from the receiving player's overall mean %
testing_df['diff_from_all'] = 0.0

# Iterate through each player to get their diff_from_all value
for i in range(len(testing_df)):
    sample = testing_df[testing_df['pass_recipient_name']==testing_df.pass_recipient_name[i]]
    mu = sample[sample['exclusion']=='None'].mean_completion_pct.values[0]
    testing_df['diff_from_all'][i] = testing_df.mean_completion_pct.values[i] - mu
Then we need to average out all excluded players’ difference from their receivers’ overall receiving rate. This averaged value is their Added Receiving Rate. For example, a player with an ARR of 1.5% means that, on average, the target of their passes should have a 1.5% better chance of receiving that pass than if any other player made that same pass.
# Drop all players with no difference from the mean
## This drops all players not on their team. Statistically speaking, we should see even a very minute difference in completion %
## In the future I want to figure a way to do this in the steps above, but can't think of a way at the moment.
testing_df = testing_df[testing_df['diff_from_all']!=0]
testing_df = testing_df.sort_values(by=['diff_from_all'], ascending=False).reset_index(drop=True)

# Now we are getting into our last stage. Grouping all our 'exclusian' players, i.e. the passers, and getting their average diff_from_all
## this average diff_from_all is their ARR! The average % chance greater(+) or less (-) than the average player that our focal passer gives the receiver to successfully control their passes
final = pd.DataFrame(testing_df.groupby(['exclusion'])['diff_from_all'].mean()).reset_index()

# Add in info on their total connections, coming into play next
final['connections'] = testing_df.groupby(['exclusion'])['pass_recipient_name'].count().tolist()

# Now we drop all players with fewer than five 10-pass connections
final = final[final['connections']>=5].sort_values(by=['diff_from_all'], ascending=False).reset_index(drop=True)

# Let's add their most-passed-from position (per StatsBomb)
final['position'] = ''
all_sample_players = final.exclusion.unique().tolist()
for i in range(len(final)):
    df_1 = df[df['player_name']==all_sample_players[i]]

    # long line, but it's getting the position the player passes from the most
    pos = pd.DataFrame(df_1.groupby(['position_name'])['position_id'].count()).reset_index().sort_values(by=['position_id'],ascending=False).position_name.values[0]
    final['position'][i] = pos

# Rename our 'exclusion' column to 'player' which is more accurate
final.rename(columns={'exclusion':'player'},inplace=True)
Example: ARR for the 2021/22 Indian Super League
Now that I’ve discussed the motivation for, theory behind, and calculation for the ARR, let’s look at how the 21/22 ISL players ranked and dig into the data a little more.
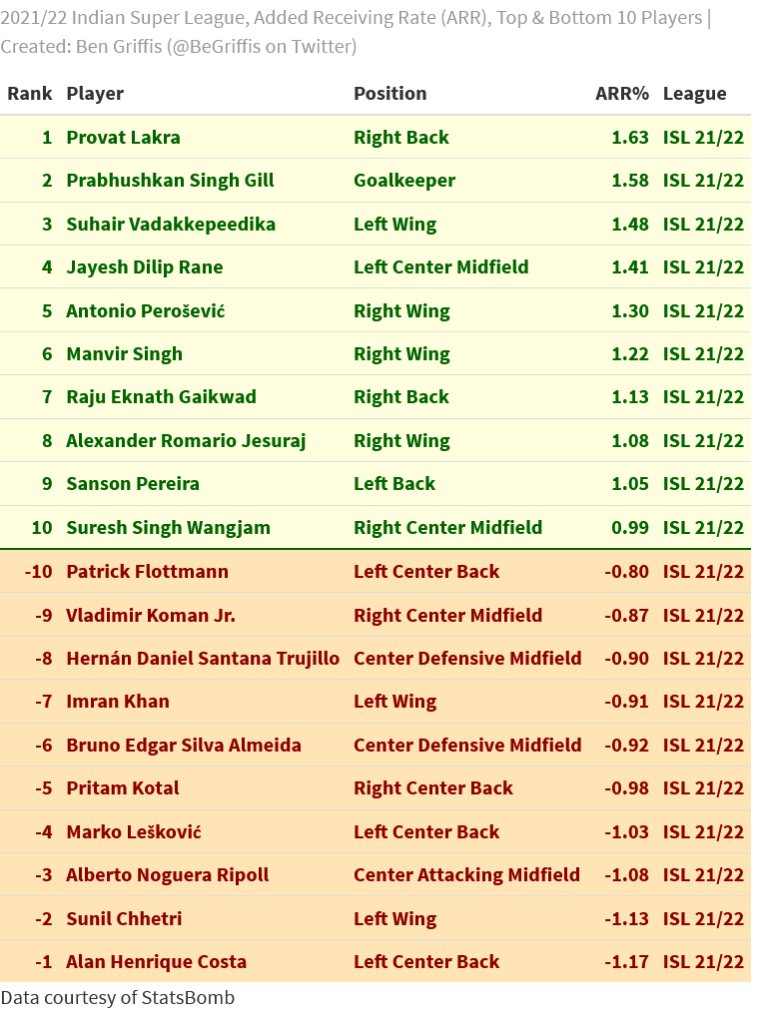
We see that the player with the highest ARR was NorthEast United’s fullback Provat Lakra. His ARR was 1.63%, meaning that we should expect the targets of his passes to receive the ball 1.63% more frequently than if an average player passed to them. While that may seem low, let’s think of basic pass completion percentages.
Most players will have very similar completion rates overall. An average passer and a fairly good passer will have different rates, but still not by much (within the same team, which is the only way we can calculate ARR). So far this season (after MD7 in the 22/23 Premier League), John Stones’ completion rate is only 2.7% higher than Rúben Dias’ completion rate.
Since pass completion percentages, while variable, are typically within 30 percentage points of each other, having relatively “low” rates of 1.63% is still something to note. Even if does not seem exceptionally high.
The best use of the ARR is probably to look at similar players and their relative ARRs. So, let’s see some examples. We will compare the passes of Provat Lakra and another NorthEast United fullback, Gurjinder Kumar, to their midfielder Hernán.
Keep in mind that Lakra recorded the best ARR, and Kumar ranks 91st (the 48th percentile as well, so below the median) with an ARR of 0.02%. So, we can say Kumar was about the definition of an average ISL passer in 21/22.


Lakra played both LB and RB last season, while Kumar was only a LB. Hernán being a CM means we can compare passes to him from either flank, since he should be evenly spaced between both FBs. We can see the relative difference in completion rates to Hernán from these two players. The player with the higher ARR has a better completion rate to Hernán than the player with the lower ARR. That’s some sort of validation for the ARR.
Let’s also look at one more example, using our 2nd-highest ARR player. Kerala Blasters’ goalkeeper, Prabhsukhan Singh Gill, had an ARR of 1.58. Let’s compare his passes to his RCB to another GK’s passes to their RCB, Amrinder Singh of ATK Mohun Bagan (who had an ARR of 0.28, ranking him 51st and the 71st percentile). Like we saw above, we should expect Gill to have a slightly better completion rate than Singh.
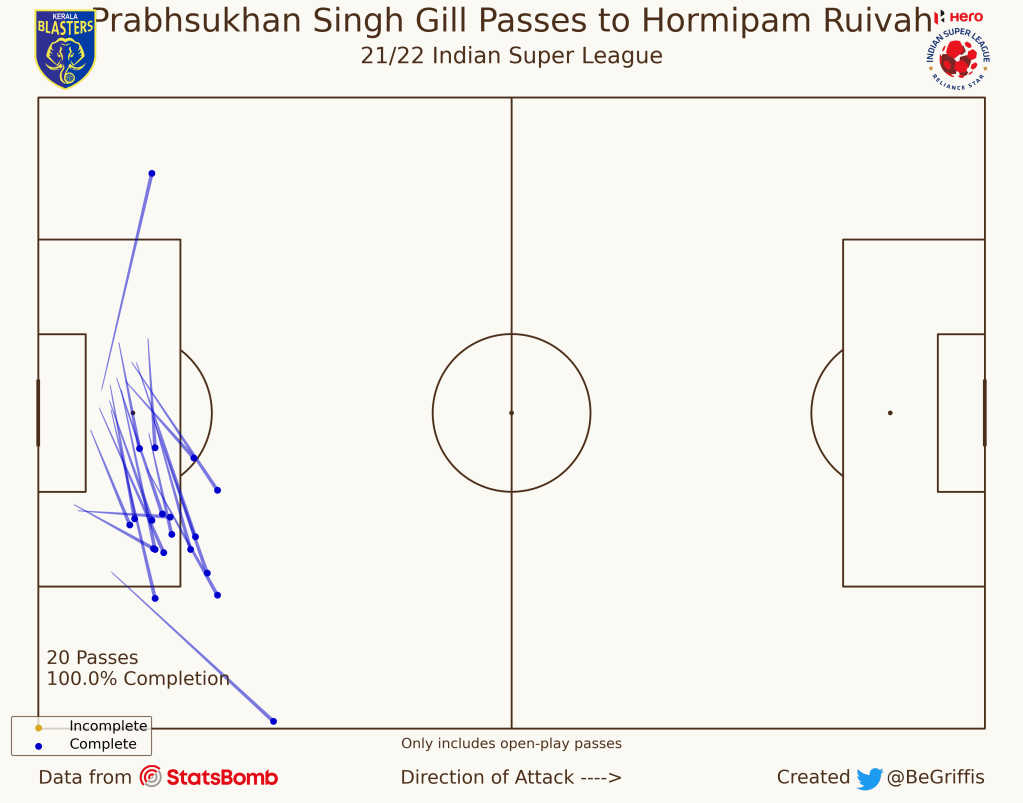
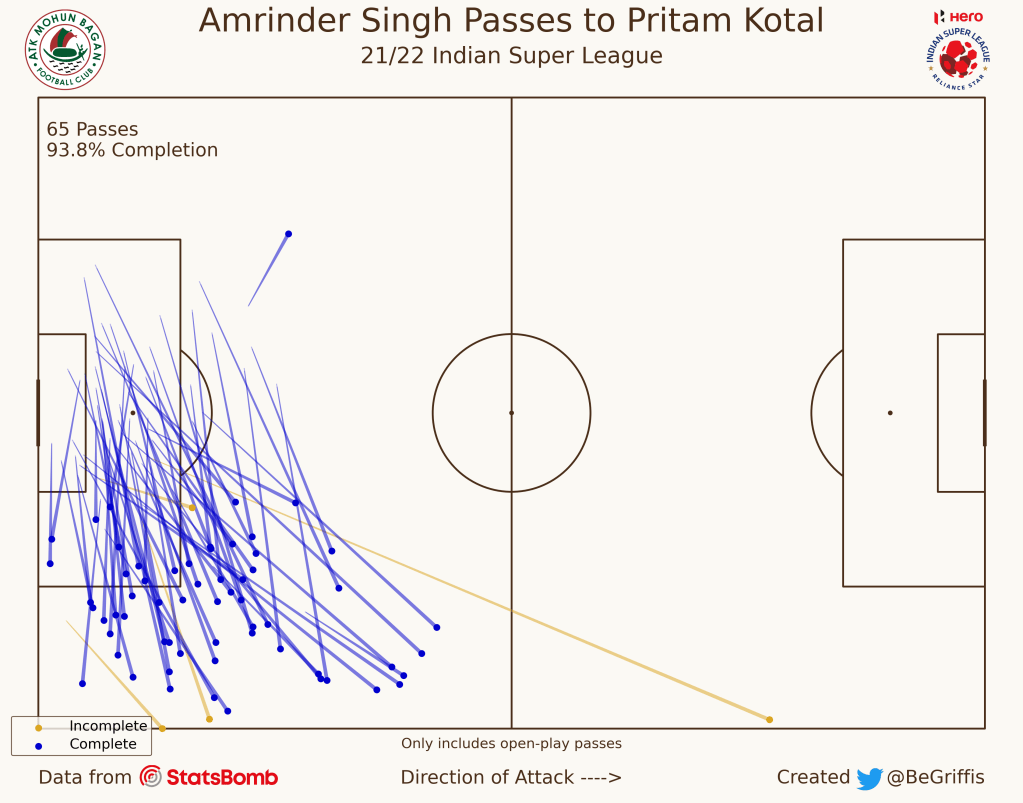
Singh certainly had more passes to his RCB Pritam Kotal than Gill had to his RCB Hormipam Ruivah, but we see the player with the higher ARR completing passes at a higher rate.
In both examples of the top 2 ARR players for 21/22, we see that their passes to the same or similar receiver are completed more frequently than players with lower ARRs. That’s expected, and also welcome validation, for the ARR.
Essentially, the ARR tells us that if we put Provat Lakra in any other fullback’s position when they make a pass, Lakra’s pass would have a better chance of being successfully received than the other FBs. The same goes for Prabhsukhan Singh Gill and any other GK.
This leads to one major caveat that exists in (this first iteration of) the ARR: its best use in this state is to compare players in the same position, possibly even the same position-role. We need more testing to see if we in fact can generalize this outside of positional bounds.
Further Examples: Women’s Super League 18/19 to 20/21
StatsBomb, besides offering the entire ISL 21/22 season, also offers England’s top women’s tier, the Women’s Super League (WSL). I won’t put any examples to the pitch since we’ve had some validation above from the ISL, but here are three seasons of top/bottom 10 players by ARR.
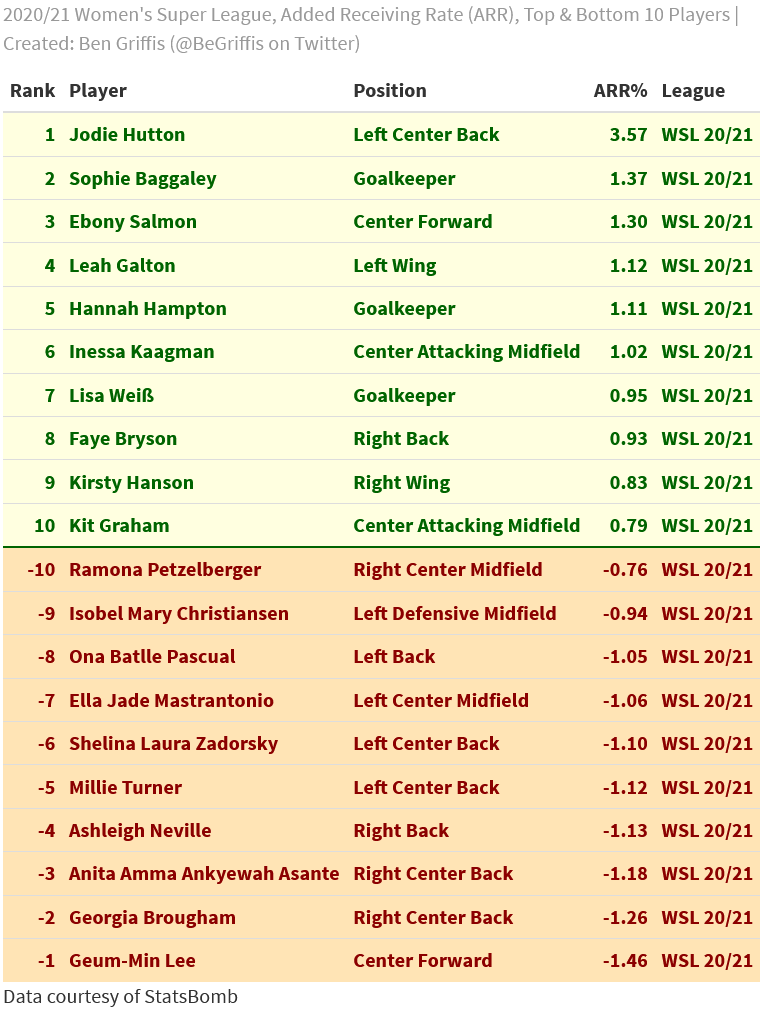
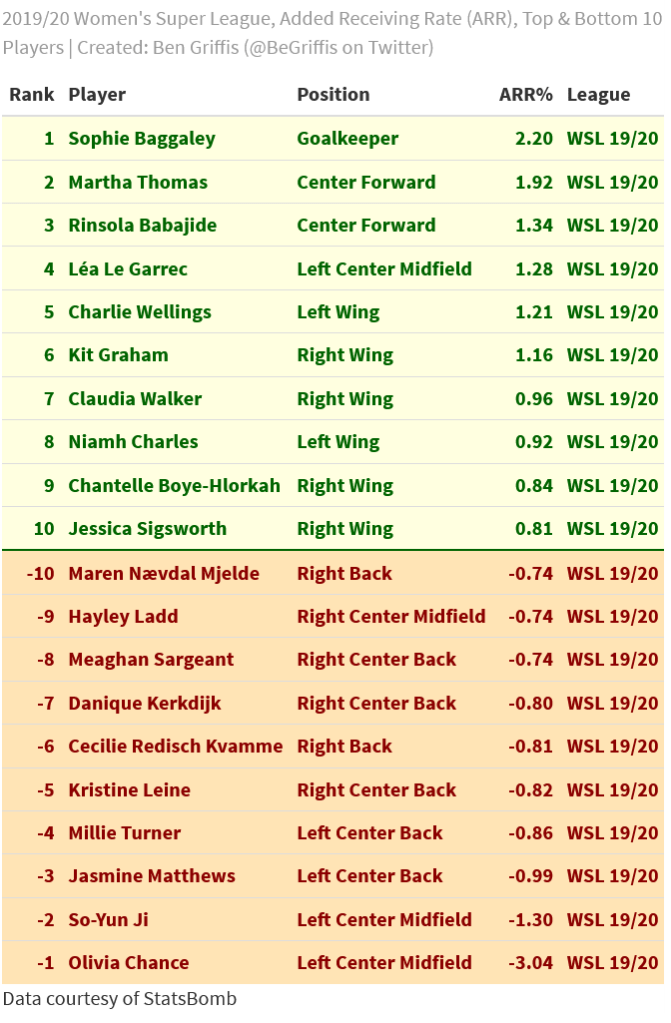
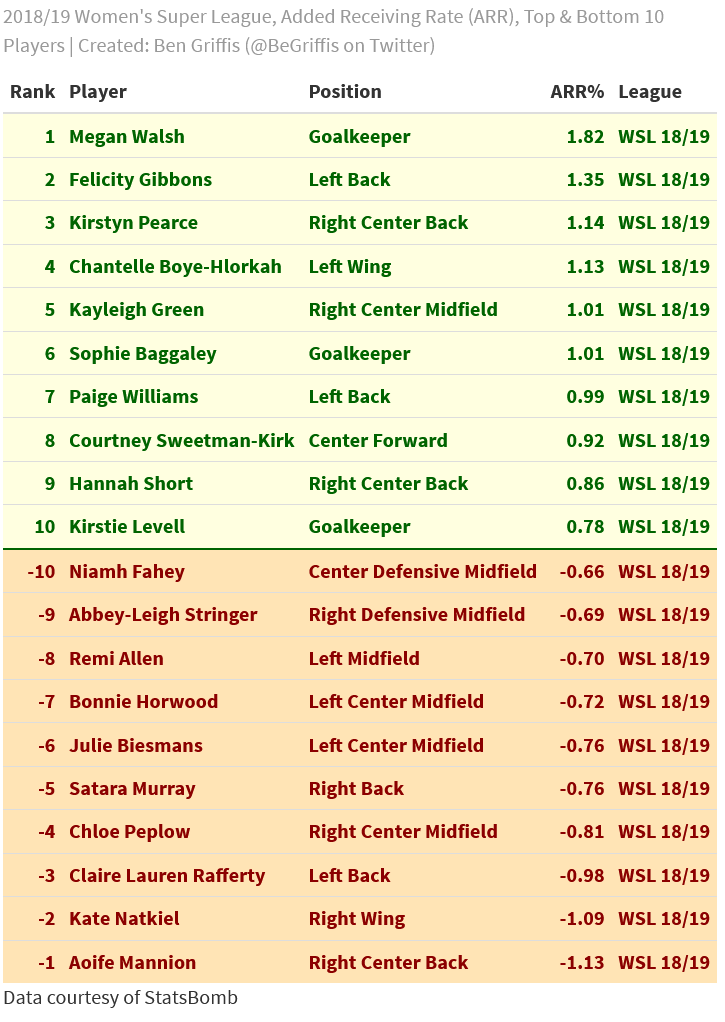
We can see that the ARRs across these two leagues and four seasons are fairly similar. There are two players that appear to have an abnormally high ARR over these four seasons. Aston Villa’s CB Jodie Hutton in 20/21 (ARR of 3.57) and Bristol City’s GK Sophie Baggaley in 19/20 (ARR of 2.20). We also see Bristol City’s CM Olivia Chance with what appears to be an abnormally low ARR in 19/20 (-3.04).
This was a welcome sight, as it probably means that we should expect most players to record an ARR of between -2% and 2%. Again, this may appear low, but in the grand scheme of a season, having a very high ARR for your position should make a difference—an extra assist, maybe, for a CAM; an extra chance created for a DM or CB, etc. The fine margins matter and ARR is but a first attempt at quantifying the finer margins of passing.
A Final Word and Further Work
In short, the Added Receiving Rate attempts to show players who are able to give their passing targets a better chance at receiving the ball than the average player (or, conversely, a worse chance!). This could come from several ways, such as a better pass placement; pace of the ball; weight of the pass; etc… Anything that makes it easier for a receiver to control their pass compared to a pass in the same circumstances from another player.
This metric should currently only be used to compare players in ideally the same position, but could be used for players in similar roles regardless of their position. In the future, I would like to have the receiver’s position in addition to or instead of their name. I would also like to expand this into various zones, so we can see players’ relative ability to complete passes across the pitch instead of only to specific players, although that’s a little out there.
The final point I want to make on this: given the lack of freely available data that includes the passer, recipient, and outcome for every pass event, ARR could be relatively restrictive to the masses to post-season analysis when/if data is available instead of an updated metric after each match.
There is still work to be done to expand on this metric, but I believe there is potential for this to be useful and interesting to both armchair analysts and professionals alike. ARR could be a useful tool to see if a player may add that extra something to your club’s midfield or help your new manager who wants their GK to be involved in buildup more frequently.

[…] might even involve much more advanced statistics than analyzing attacking skills. A metric I’ve developed in the past uses a method that we could use to start addressing the issues I’ve written about here, but would […]
LikeLike