
Article by Ben Griffis
I’m not a betting man. However, I love coding, so I wanted to make a model that simulates a full season of a league. I’ve posted threads on Twitter simulating the 1. Bundesliga, 2. Bundesliga, and J1 League, but now want to share a little more detail on the process while showing the results of my Serie A simulation.
The General Idea
The overall process takes input data from the prior season, makes slight alterations based on transfers/feelings/managers/etc., and then runs that data through my model to simulate a pair of results for each match-up (since the league is a round-robin).
I won’t share the model here, since while I’m writing an article on it, I still have plenty of work to do on it throughout this season to tune it for each league. I’ve also noticed that the final positions are fairly decent when simulating a completed season, but the points can be far off. Essentially, the points for the top and bottom few teams appear to be more extreme than in real life, even if the positions match up rather well. Hence the need for fine tuning!
So let’s get more into the process.
The Data
The input data is the mean & standard deviation for expected goals (xG), expected goals against (xGA), and a club’s actual goal difference compared to expected goal difference (GD-xGD).
Below is a screenshot of the input data. Sources are StatsBomb via FBRef for the 21/22 Serie A teams, and Wyscout for the 21/22 Serie B teams.

We have the mean and standard deviation for each team’s 21/22 in grey. Next, I have a very subjective way of changing their data. I jotted down percent changes for each team’s mean xG and xGA from 21/22 to 22/23. I looked at transfers, tried to find some fan sentiment on Twitter, and just general feelings I have ahead of next season to determine this.
Please, please note: that is not very “statistically rigorous”, it’s just my notions… But since we can’t actually predict next season’s average xG/xGA, I figured some slight changes will work fine. You may have very different thoughts for each team, which is fine! You can always reach out to me and ask me to change some teams and I’ll run a new table for you when I have time… The new averages are in yellow.
Notice that I didn’t change the GD-xGD averages. I had been doing that initially, but decided that we certainly can’t predict that with any confidence, whereas xG/xGA we may have some notions. So I keep it in the data, but turn all GD-xGD averages to 0, and standard deviations to 1 (so that it becomes a normal bell curve).
After all the data is set, I put it through my rough model.
The Model
While I won’t share the model itself (since I’m still going to be updating it throughout the season), I can explain the idea of it.
The output of the model is not goals for/against. I was having no luck with that, but stumbled upon much better luck with a result-only model. So, the model outputs 2 results for each pair of teams.
To get those 2 results, it uses a Monte Carlo normal simulation. Read about that in more depth here, but I’ll explain the general idea. My Monte Carlo simulation essentially generates a random number from a normal distribution with a mean and standard deviation. The mean and standard deviations are the ones in the table above.
For each individual match, the simulation chooses a random xG, xGA, and GD-xGD value based on the input data. Again, remember I decided to use 0 and 1 as the GD-xGD mean and standard deviation respectively (a classic normal distribution).
These randomly-generated numbers are then run through the model with logic to determine the final result of the match: win/draw/loss. The overall idea takes into account a team’s randomly-generated xG for a match, their opponent’s xG, and a random over-/under-performance of their xG-xGA, since teams with higher xG often lose their games. I needed to include something so that there’s still unpredictability when a top team plays a poor team.
I simulate 50 individual games between each pair of teams to get a predicted result. I used 50 since, while it’s still a large aggregate number of matches played, it’s also low enough to invite unpredictability! And that’s what I want, since I’m not creating this to win money by betting, but to have fun and see some interesting tables.
Since I have 2 results for each pair of teams, this 50-match simulation is repeated twice for a total of 100 matches per pair of teams. Repeat for all pairings and then the program gives me the output of each individual home/away series for the league.
After the program spits out the matrix of results I use excel to generate the final table. Sadly, I haven’t been able to get everything to work in a single Python code so it’s still a bit manual. Oh well.
I then repeat the full simulation process several times to get multiple tables. For Serie A, I simulated 10 different seasons.
Aggregate Simulated Table
Below is the average points and league position for each team after 10 simulated seasons. Sorted on average position, as I’ve said that I’m more confident in my model’s positions than points. The 10-season average has done a decent job of smoothing out the extreme high/low points from individual tables, but I’ll admit there’s no way Inter are lone dogs at the top with a huge gap to the rest of the European qualification spots.
Let’s take a look!
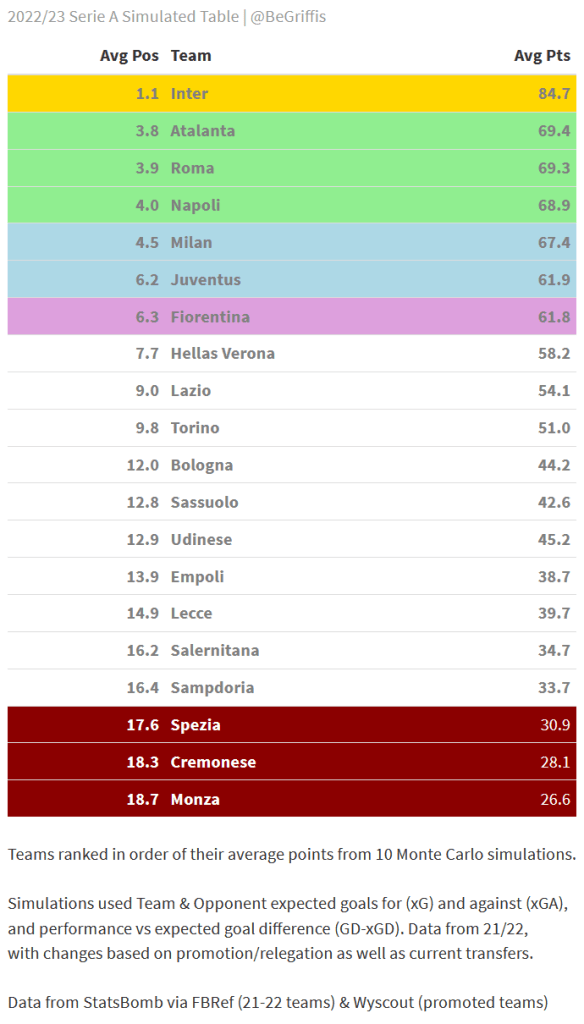
Inter are clearly my model’s favorite to win, an in fact won the league in 9 of my 10 simulated seasons! They have the best average xG by far in 21/22 and again in my 22/23 changes. Of course, simply having better xG doesn’t make you win games, but most simulation models looking at xG will tend to favor that. Even with a randomly generated GD-xGD number increasing or decreasing their performance in each simulated game, they still come out on top.
Atalanta, Roma, and Napoli are predicted to fill out the Champions League spots. My gut wants to say that could happen, as Atalanta should definitely expect to improve on their 21/22 and Roma were relatively close at times to the top 4 and showed some great flashes of form in the second half of the season, unbeaten in Serie A from January 16th to April 23rd.
Milan and Juventus are predicted to qualify for Europa League, which would probably be a disappointment for both, but maybe more expected for Juventus with their recent struggles. I, for one, would find it fun to see Juve finish not just outside the top 4, but in 6th.
Fiorentina are predicted for 7th, but actually have a very similar average position to Juventus…
Overall, the top 7 teams are almost split into 3 categories by the simulation. Inter, the followers (Atalanta, Roma, Napoli, Milan), and the European stragglers (Juventus and Fiorentina). These groups appear when looking at their average points and positions. I think a notable exclusion here is Lazio, who could very well make it into Europe again, and Verona as well if they have another good season.
Relegation candidates seem to be set with Spezia, Cremonese, and Monza. There’s over 1 average position and about 3 average points separating Sampdoria in 17th & Spezia in 18th in the average table, so those three teams are who my model has decided on going down. That’s definitely possible too.
Now let’s look at all 10 tables individually!
10 Simulated Tables
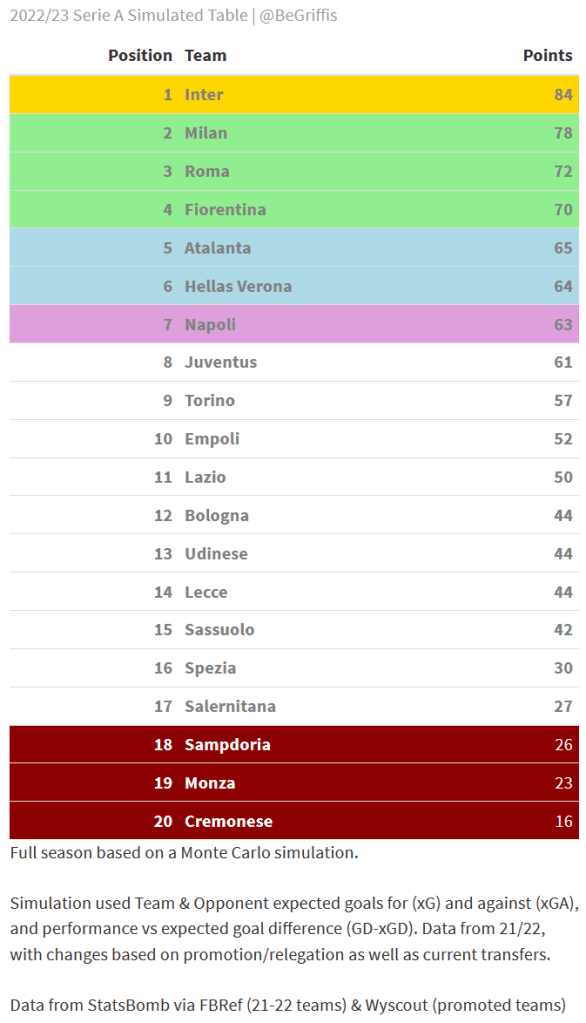
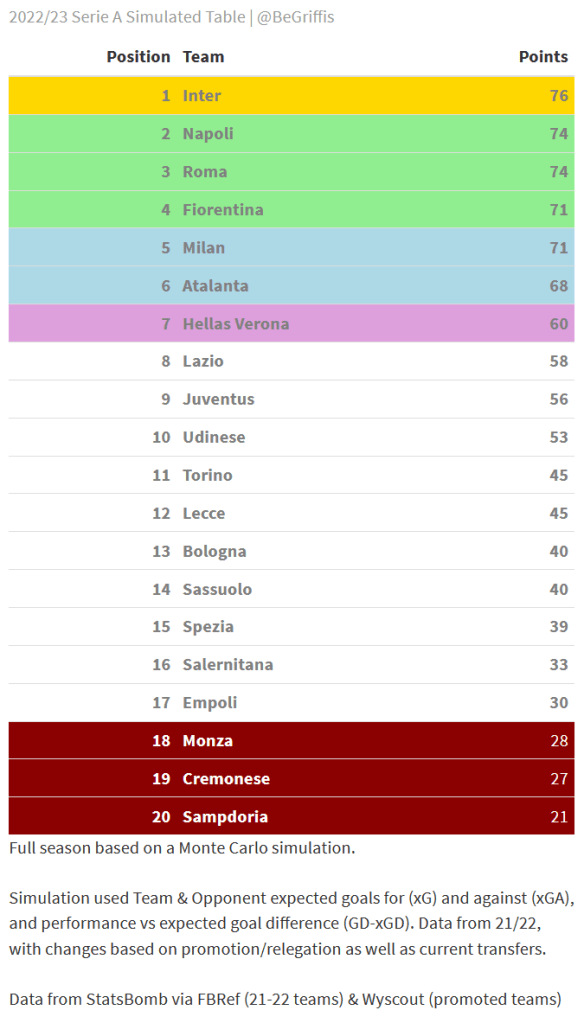
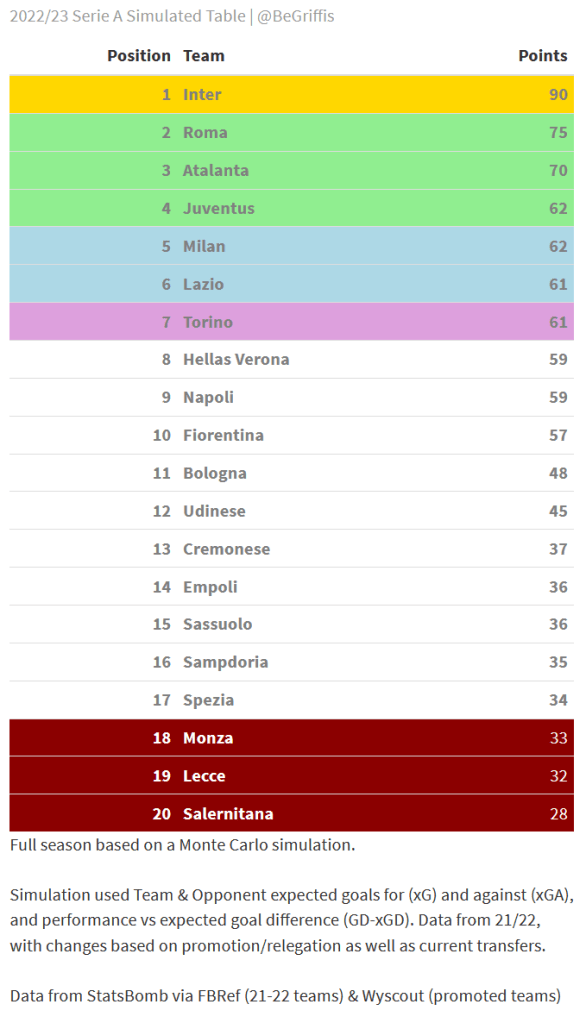
This is a fun table. Pretty sure Allegri and Spalletti would be sacked in a heartbeat. But, it’s not terribly far from possibility, even if we look at the points! Yes, sometimes the model spits out relatively realistic point totals.
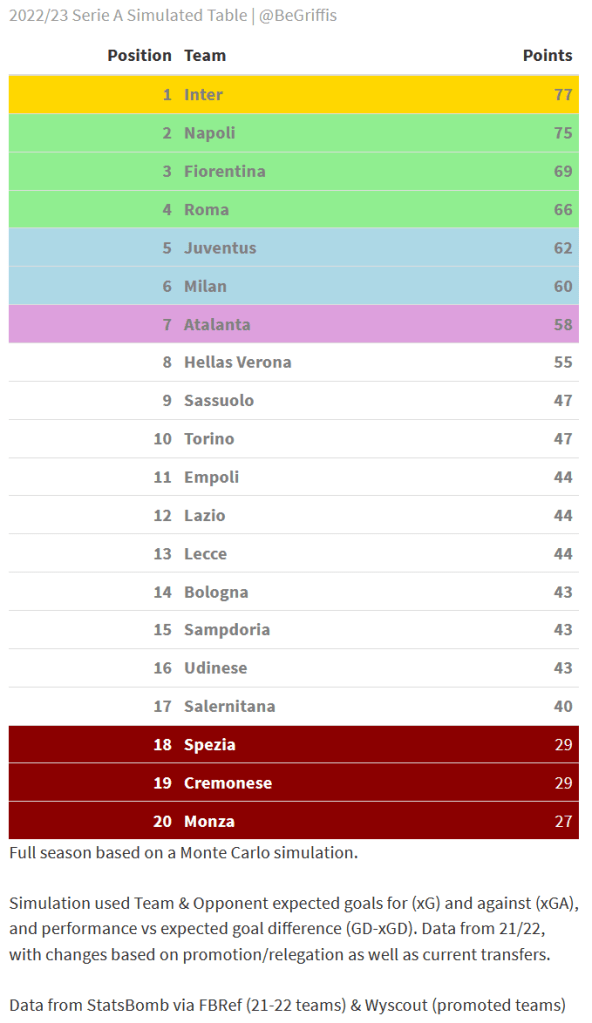
I’d love this, seeing La Viola back in the Champions League would be great.
Again we can see Allegri sacked in this table… And while we don’t see granular results here, I’d like to imagine Salernitana make yet another great escape at the end of the season. Top 4 I think is very realistic though, maybe not in that order but the Milan clubs plus Napoli and Atalanta aren’t bad shouts.
This table may be a little more boring, but still with Juve in the Conference League which would be hilarious. All 3 newly-promoted sides back down, with maybe Bologna and Salernitana’s positions a little surprising but not incredibly unrealistic.
I’d like to point out here that my model has consistently done Lazio dirty. As a Romanista that’s unplanned but a welcome sight. In my input data, I didn’t change their average xG but actually also improved their xGA by 10%… They over-performed their xG by about 0.35 on average last season, the greatest in the league, so without that help this coming season their position may be vulnerable.
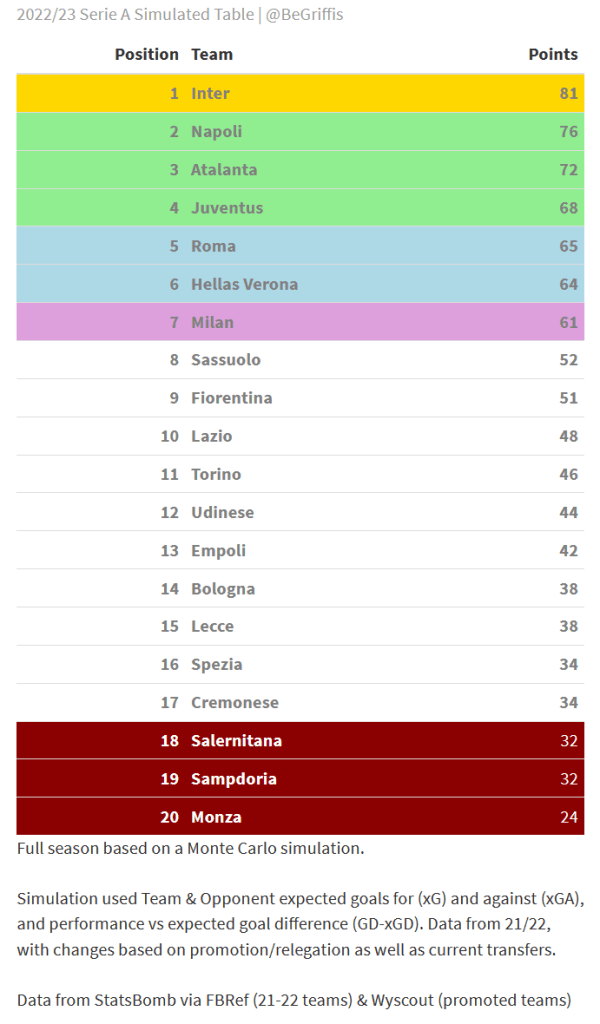
Again we have a very fun top 7 for this table. Lecce also surprising here and finishing 12th, but they did go out and buy the Swiss Super League’s 2nd-top scorer in 21/22, so maybe they do end up shocking people.
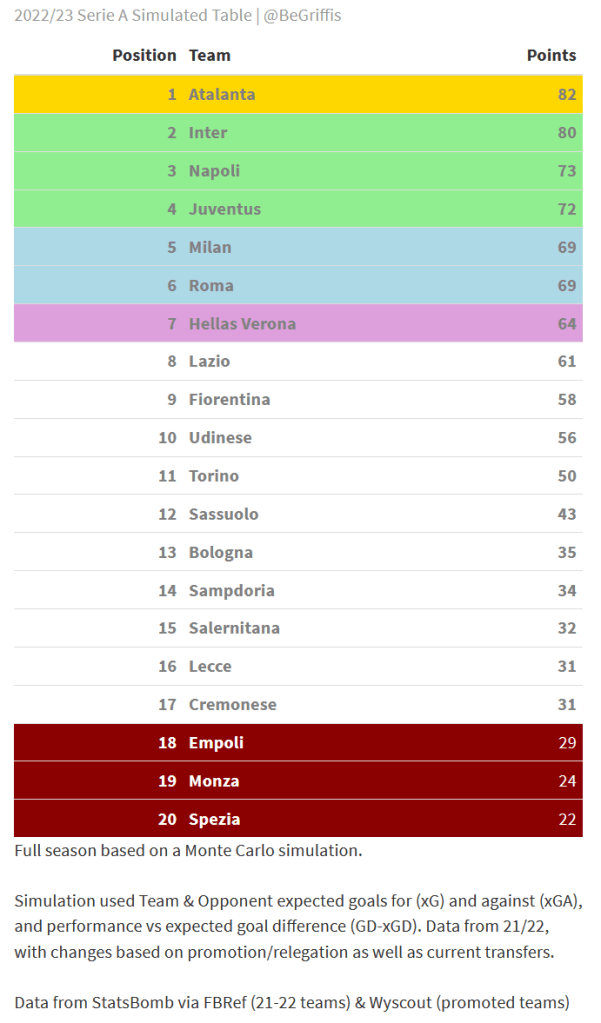
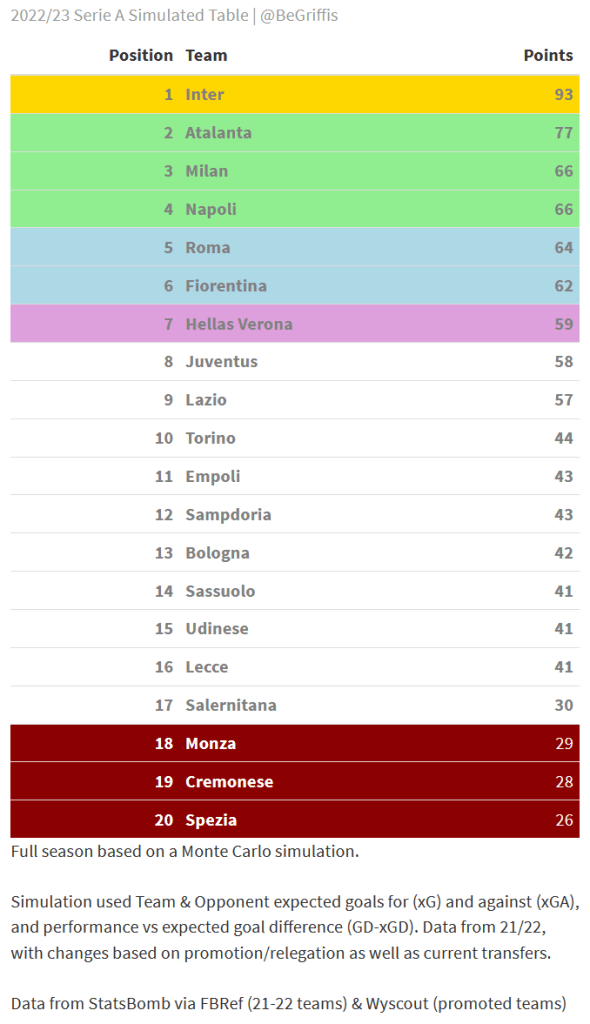
And here’s the only table of these 10 simulations where Inter don’t win the Scudetto. Atalanta finally get theirs, much to everyone’s joy at finally seeing Gasperini’s project get that first title since 1963. Juventus finally qualify for the Champions League. Took them to the 5th simulated season to do so…
Juventus now with two Champions League qualifications in a row! Great job lads. Milan drop back to 7th like it’s the, uh, 2010s again. Two of our new teams manage to stay up in this table.
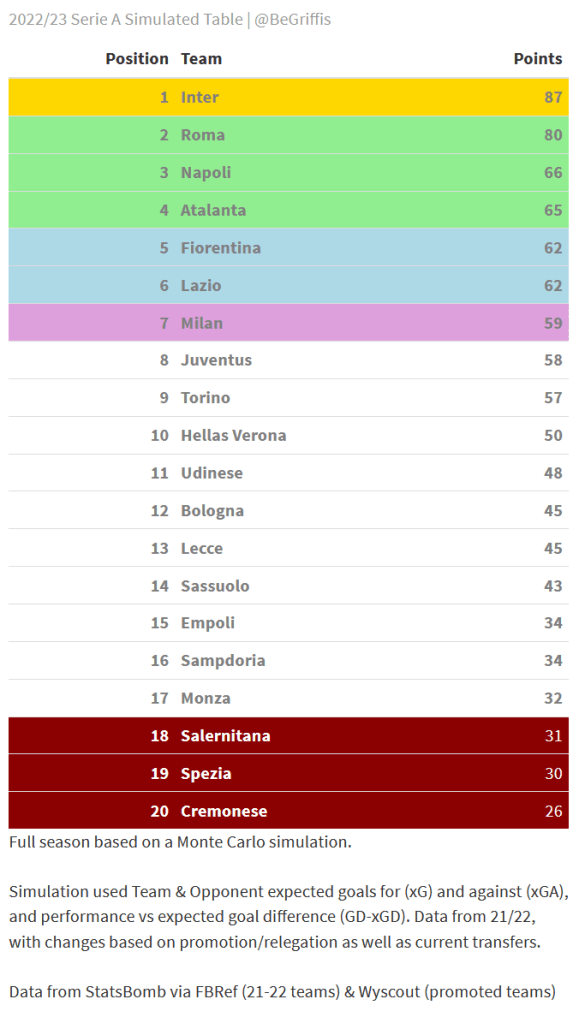
I would love for this to be reality. Roma 2nd. obviously behind Inter in 1st but still miles ahead of the rest of the competition. José Mourinho masterclass in this simulation. Juventus also lose out yet again on European qualification, with Atalanta, Fiorentina, and Lazio all within 3 points of each other in 4th through 7th, which I’ll imagine was a final-day scrap for that final Champions League spot. Similarly, let’s imagine Monza, Salernitana, and Spezia all have a loser-gets-relegated fight on the final day.
This is why I make these simulations.
Again, we see Roma finishing 2nd, let’s pretend Tammy Abraham also wins the Capocannoniere and finally breaking that 36-goal record. Lots of relegation spots open in this table, with a total of 6 teams within 3 points of safety/relegation.
Napoli narrowly missing out on the league like they did in 17/18. Lazio in 12th, which would truly be a story to watch all season. They haven’t finished 12th since 09/10.
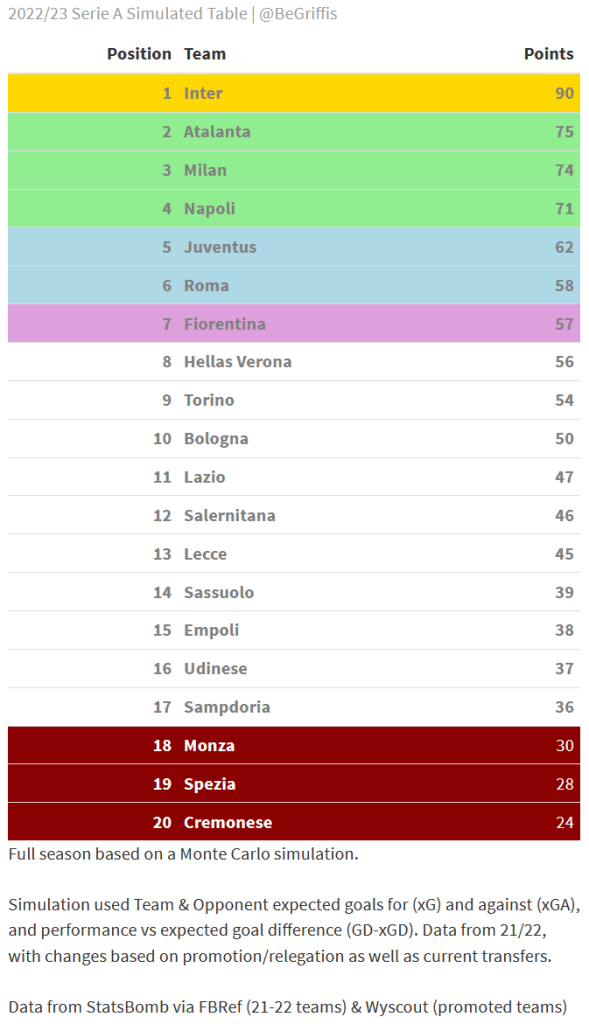
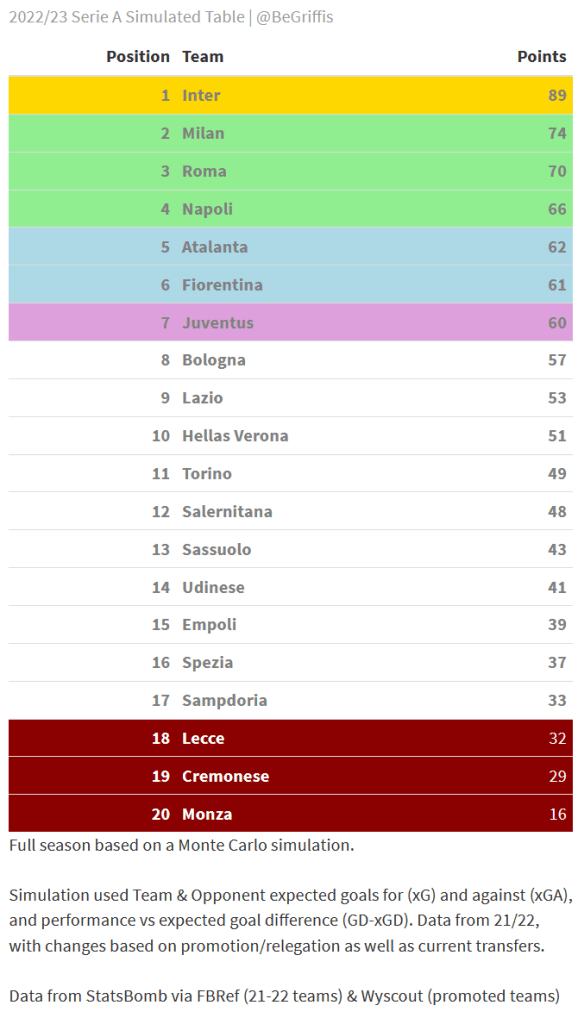
Now our final table. The second in a row where our 10-table aggregate relegation candidates are all relegated, showing how my model doesn’t think Monza, Spezia, and Cremonese can stay up. Sorry Silvio Berlusconi.
The Final Word
Overall, while the 100simulation average table may have some interesting components, it’s not completely unrealistic. The model itself is pretty good but not amazing, however that does add some elements of surprise into the tables which is honestly why I’m sharing this all now. Some elements of fun, some elements of realism and actual data analysis/manipulation.
As Gattuso said, “sometimes maybe good, sometimes maybe shit”……
……The essence of my current simulation model. Unless this actually happens and then I’ll sell the model for a hefty profit and retire.
