Written by Ben Griffis
The 2022/23 Superliga season is just about a week away. I’m planning to analyze a game from each round as time permits to have enough analyses to write an end-of-season tactical review for several teams.
For this piece, I’ll be looking at several important data points from each club’s season as well as call out a couple important players for the teams in 21/22 that could stay vital as well as any key transfers made so far.
Here’s the final table from 21/22. FC Copenhagen won their 14th title, with FC Midtjylland qualifying for the Champions League as well by finishing 2nd. Newly-promoted Silkeborg manager to surprise and finish 3rd, qualifying for Europe (Europa League) for the first time since the 2001/02 season. Brøndby qualified for the Europa Conference League, while Viborg beat AaB in the playoff match to clinch the final Conference League spot.

I present several key statistics for the season reviews. Moving clockwise from top left, they are:
– Moving Average Expected Goals for (xG) & against (xGA)
– Passes allowed per defensive action (which is a measure of a team’s pressing intensity, lower means more intense) & possession for each match
– Match tempo and pacing information, so we can see how quickly the teams tend to play in possession
– Finally, the xG & xGA for each match. The diagonal line in this graph represents where xG = xGA.
FC Copenhagen
21/22 Data Review
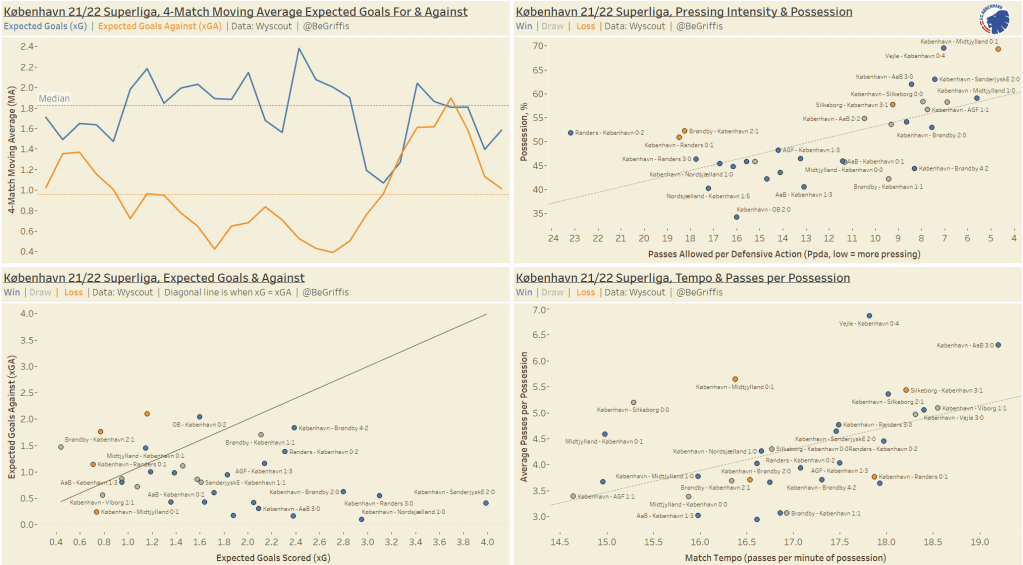
The first thing that stands out for FC Copenhagen’s moving average xG & xGA chart is their sudden increase in xGA over the final stretch of the season. For those new to the Superliga, that makes sense since the league splits after 22 matches (a full round robin) into the Championship and Relegation groups. So, Copenhagen played their final 10 matches against the other 5 best teams in the league. We sometimes see a change in performances because clubs aren’t playing bottom-side teams anymore.
We can also see how Copenhagen’s median expected goal difference (xGD) was about 0.8. It’s no shock that they won the league given that they had both the best xGD and actual goal difference!
Looking now at the graph in the bottom left, which shows each match’s xG and xGA, we see Copenhagen had a negative expected goal difference in only 6 of their 33 matches. They won 2 of these matches and drew a third. That’s an impressive record. Further, they only lost a single game where their xGD was positive.
The other two graphs offer a little more detail into their style of play rather than performance, as xG & xGA does. First let’s look at the graph in the top right, which looks at possession and PPDA. PPDA (passes allowed per defensive action) is a measure of pressing intensity. It looks at the opponent’s passes in their defensive 60% of the pitch (so the defensive half and just past midfield) and the number of challenges a team makes in that area of the pitch. A lower PPDA value indicates more challenges per opponent pass, meaning greater pressing intensity. In this graph I’ve plotted PPDA with possession so we can get a feel for Copenhagen’s pressing & possession style.
We naturally find a correlation between more intense pressing and more possession. And we see that Copenhagen typically pressed fairly intensely over the season. What I find interesting, however, is that 2 of their 4 losses were in matches with less intense pressing. However, there is probably too small of a sample of losses to make any conclusions, especially considering that one of their losses also came in the game they pressed the most all season.
Another interesting aspect to this chart is that we almost see two distinct groups of points, one with high pressing and lots of possession, and another with low pressing and less possession. Overall, this graph shows us that Copenhagen aren’t always an intensely pressing side who look to dominate the ball. Rather, they can play both ways, pressing & possession, or relatively less pressure and possession. And they’re very successful at both styles!
Finally, we move to the chart showing a couple tempo metrics. the X axis shows us the number of passes per minute of possession Copenhagen had, while the Y axis shows us the average number of passes they had in each possession. A possession here is an unbroken string of passes, whereas the time of possession is the total live-ball time, in minutes, that Copenhagen had the ball.
Overall, we see a correlation which is again to be expected. Teams with more passes per minute should naturally have more passes per possession. However, we do see some major exceptions here, which are essentially the matches where Copenhagen dominated the ball (take, for example, FCK-FCM 0:1 and Vejle-FCK 0:4). I like looking at matches in this graph to get a feeling for how fast Copenhagen tend to play when they have the ball. Just like with PPDA & possession, we see that they have a decent spread of tempos and can succeed when playing relatively slower or faster.
FC Copenhagen being able to win games last season where they played different pressing styles, passing styles, and had a negative xGD is the mark of a good team.
21/22 Formations
Here is a breakdown of FC Copenhagen’s formations played as a percent of total minutes played. The screenshot is from Wyscout (with permission to post).
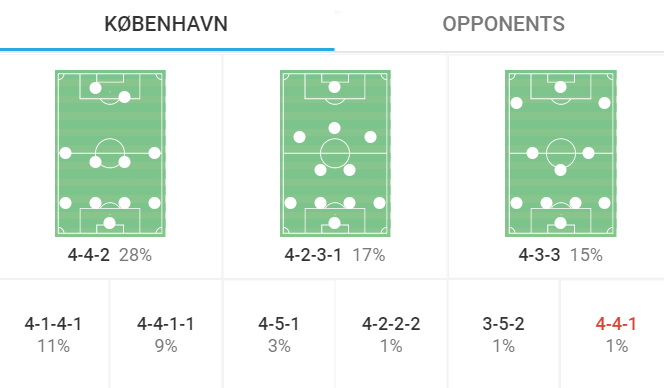
Copenhagen mainly played a 4-4-2 (about 28% of the season), however played a 4-2-3-1 and 4-3-3 fairly often as well. With no change in manager and no major transfers forcing a tactical change (yet at least), we should expect a rotation of these formations again next season. However, manager Jess Thorup has played a 4-1-4-1 in both of the team’s pre-season friendlies so far. That was their 4th most-used formation last season, so perhaps we’ll see that more frequently in 22/23.
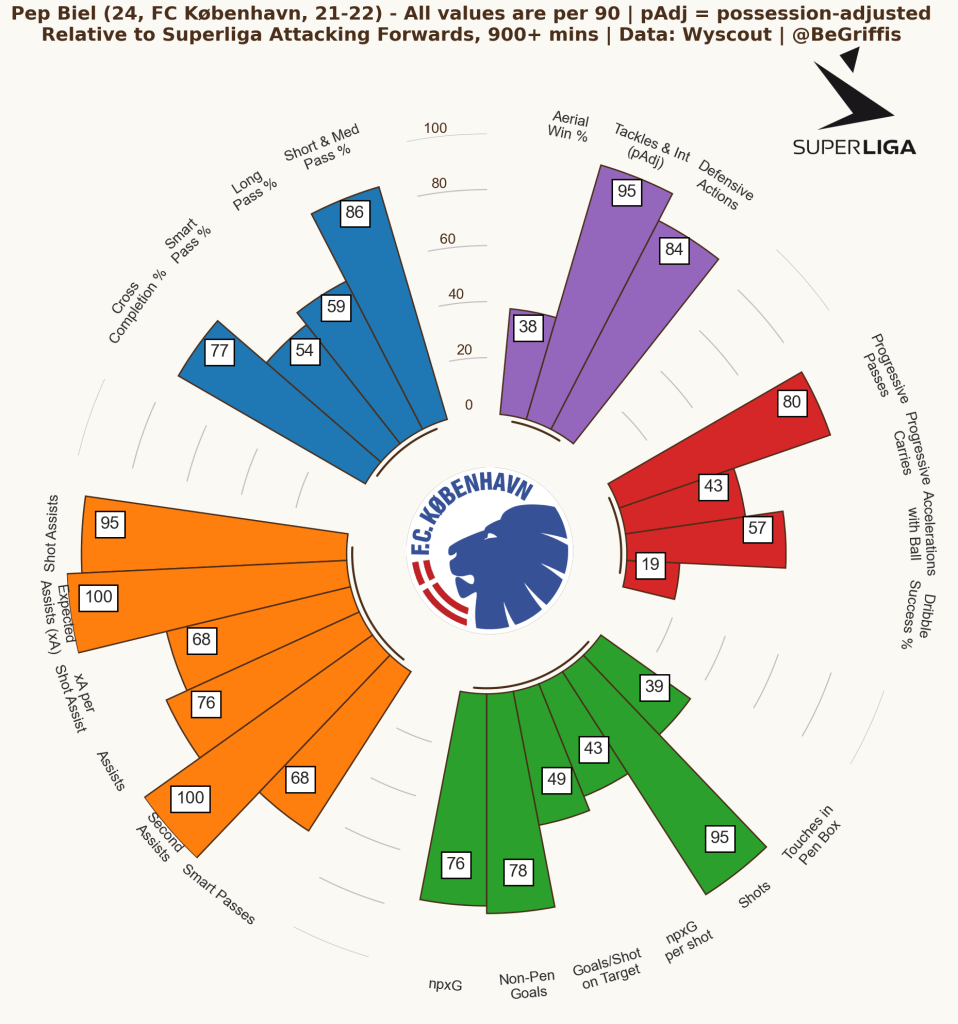
Key Players
We can’t deny the importance of Pep Biel to FC Copenhagen. Striker, winger, midfielder… he can and does play anywhere where he can cause danger. He was both their top scorer and top assister this season. He was also the player with the most second assists in the league, which are the passes to the player who then makes an assist. Biel has been very good for a few seasons now, but vital this season, playing in each match and start 30 of them. If he can keep up his performance next season, Copenhagen will be a good shout to defend their title.
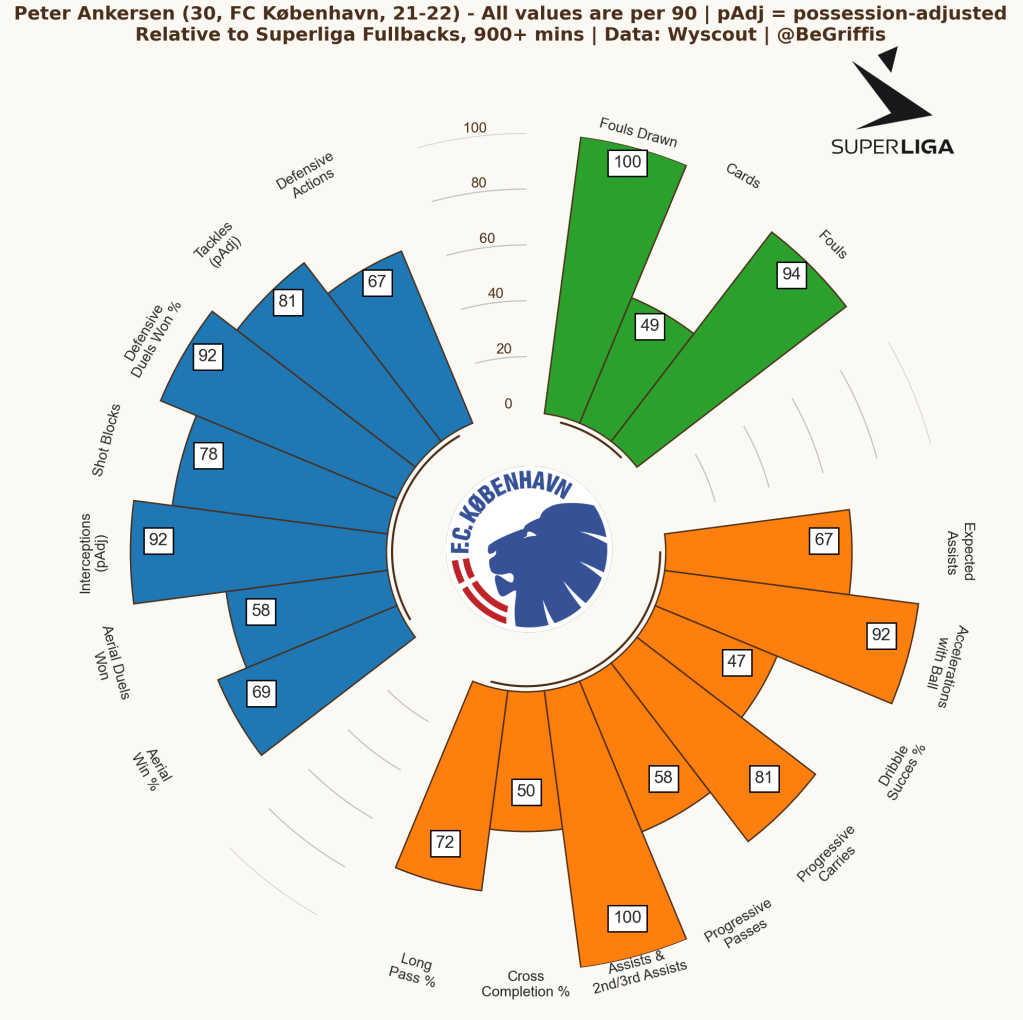
A second player who was very important to Copenhagen was right back Peter Ankersen. Ankersen was not only very reliable in defense, but also key to facilitating Copenhagen’s many attacks down the right flank. In many of their matches, FC Copenhagen produced more xG from the right flank than from the left flank or center of the park. This is in no small part due to Ankersen. A key metric I want to call out for him is that he ranked #1 for all fullbacks with at least 900 minutes played in combined second & third assists. While his crossing might be perfectly average against other fullbacks, being able to be involved in Copenhagen’s attacks while still being one of the best fullbacks in the league for defensive metrics helped the entire team.
FC Midtjylland
21/22 Data Review
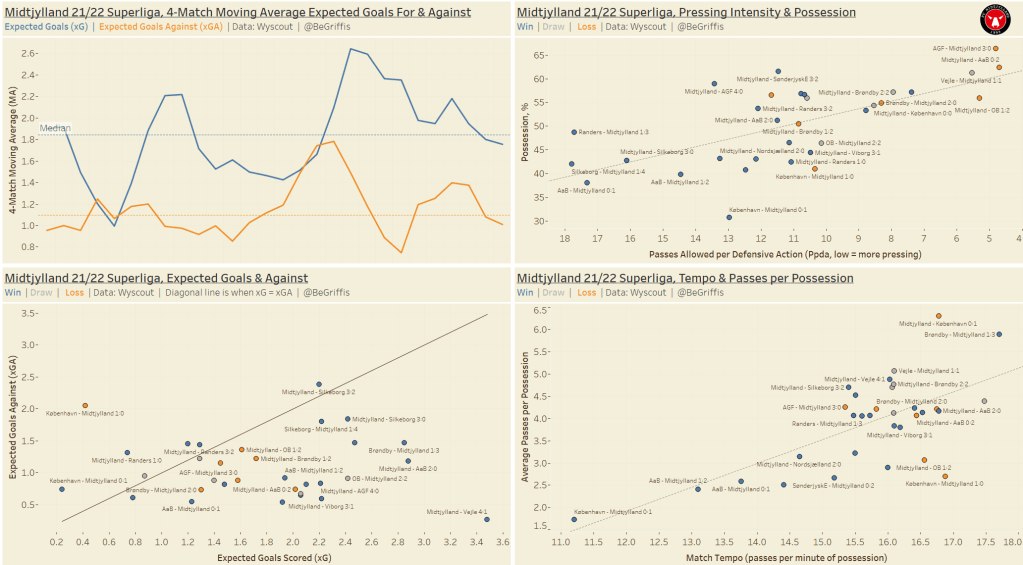
FC Midtjylland’s moving average xG and xGA plot is almost as impressive as FC Copenhagen’s. We can see large stretches where they were blowing their opponents away, however there was also a large xGA increase about the start of the Championship round. Their xG also decreased around this time. Overall, though, their xG & xGA performances were very impressive and with Midtjylland, we should expect that again next season.
An even more impressive feat was their ability to turn negative xGD games into victories, as we see in the bottom left graph. 7 games they had negative xGD, turning 5 into wins, 1 draw, and only a solitary loss. However, they lost 6 matches where they had more xG than their opponents. Copenhagen only lost one positive xGD match, proving further that they were the rightful title winners.
Midtjylland’s PPDA & possession graph doesn’t show distinct groups like Copenhagen’s did, however there is a slightly interesting insight. They only won 2 of their 9 intense pressing matches. Midtjylland had 9 matches with a PPDA less than 10, but recorded a 2-3-4 record in those games. It’s possibly worrying for manager Bo Henriksen that his team couldn’t often win matches where they pressed intensely even when they pressed intensely for almost a third of their matches. Henriksen should address this issue ahead of the season either by pressing intensely in fewer matches or by training his team in the press. In Midtjylland’s only pre-season game so far, a 3-2 win vs OB, they recorded a PPDA of 9.33. So while just a single match, they were able to win a friendly with a PPDA below 10 which could indicate work is being done.
Moving on to our final chart. Midtjylland recorded a very high tempo in the vast majority of their matches. They moved the ball around the pitch quickly and with purpose while also being able to string together several passes during each possession on average.
Looking at these selected data, two key areas for improvement this coming season for Midtjylland are being able to win games they’re expected to win, as well as to get better at winning games where they press intensely. Even marginal improvements there could have led to them lifting the title, as they finished just 3 points behind Copenhagen.
21/22 Formations
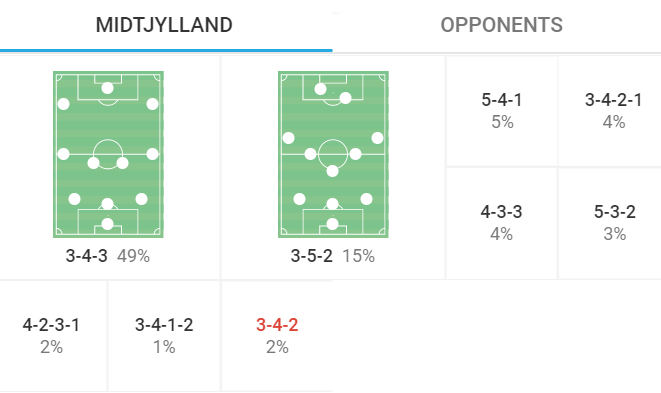
FC Midtjylland were very consistent in their formation last season. 3-4-3 almost half the time, with a 3-5-2 being their 2nd most-used formation at just 15% of the season. In the single pre-season match played so far they lined up in a 3-4-3, so expect to see Henriksen line up in a similar fashion this coming season.
Key Players
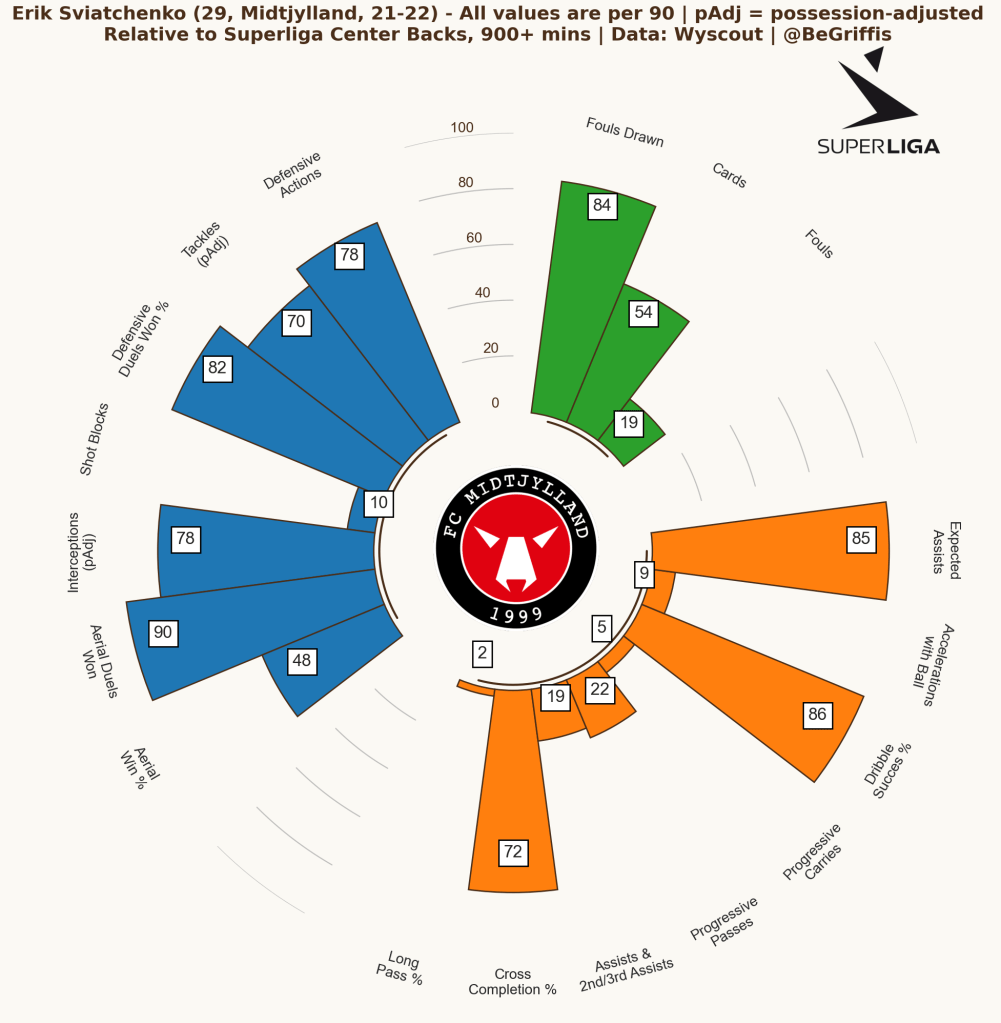
Captain Erik Sviatchenko had yet another season as one of the top center backs in the league. He’s a center back who loves defending and is very good at it, as his radar below shows. Expectations are always high for him and he should be important again, in what will be his 14th season making an appearance for the club.
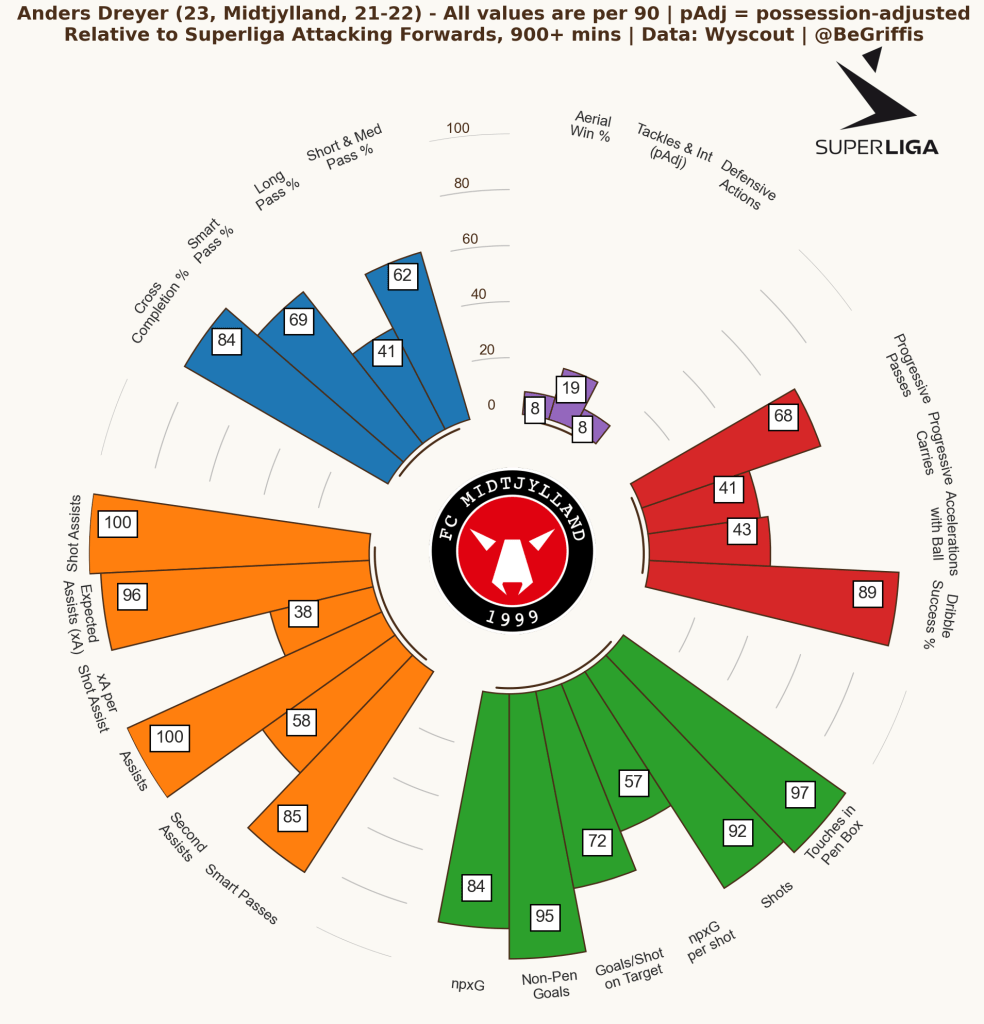
Striker/Right winger Anders Dreyer returned to the club in March, on loan from Rubin Kazan in Russia where he transferred to at the start of the season. He rejoined permanently at the start of the month which should be a big plus for the club. He was involved in 1.08 goals & assists per 90 minutes in his 16 total matches for Midtjylland this season, and his radar below shows his crazy production.
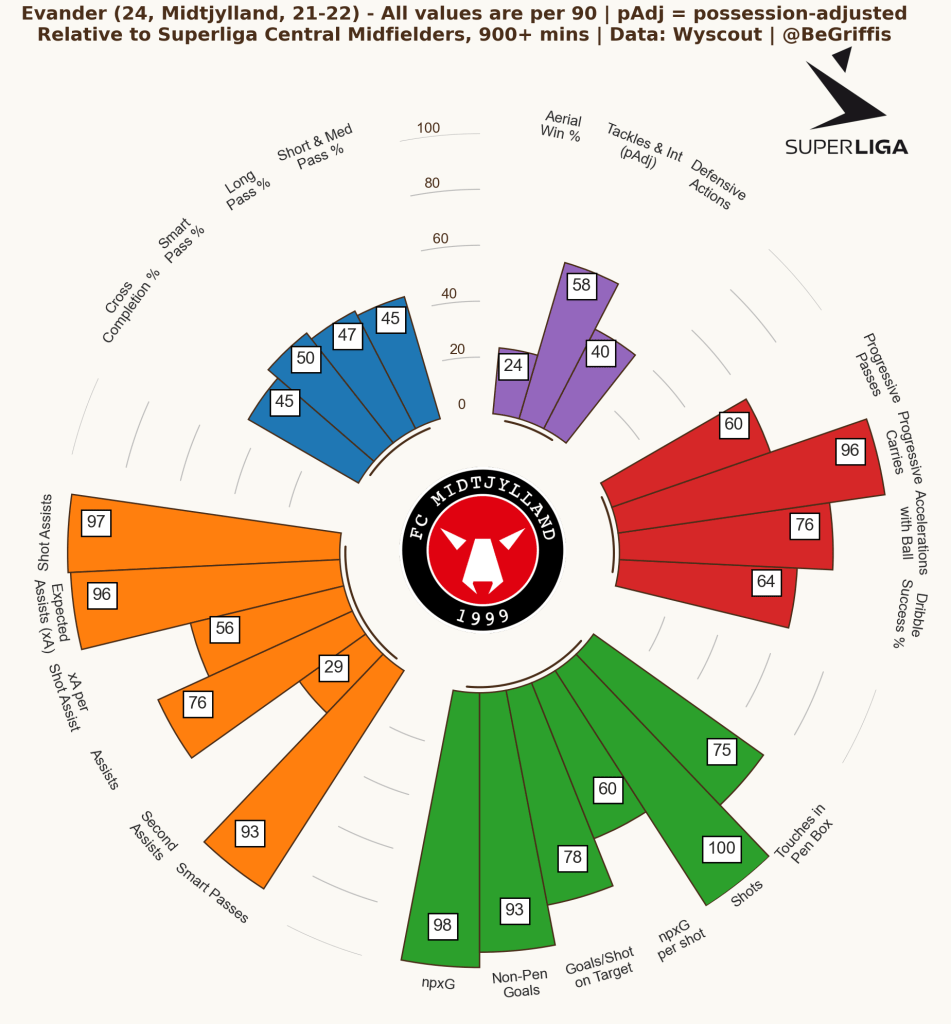
A third key player, this time in the midfield, is Evander. So much of Midtyjlland’s midfield creativity comes from him, recording some of the highest numbers in shot assists, smart passes (passes aimed at breaking down opponent lines), and expected assists (xA). He’s also got an eye for goal, being Midtjylland’s joint-top non-penalty scorer this season with 8.
Silkeborg IF
21/22 Data Review
Silkeborg finished the season in 3rd place despite being newly promoted after a few seasons of yo-yoing between the Superliga and 1. Division. This was their best league finish since finishing 3rd as well in 2000/01.
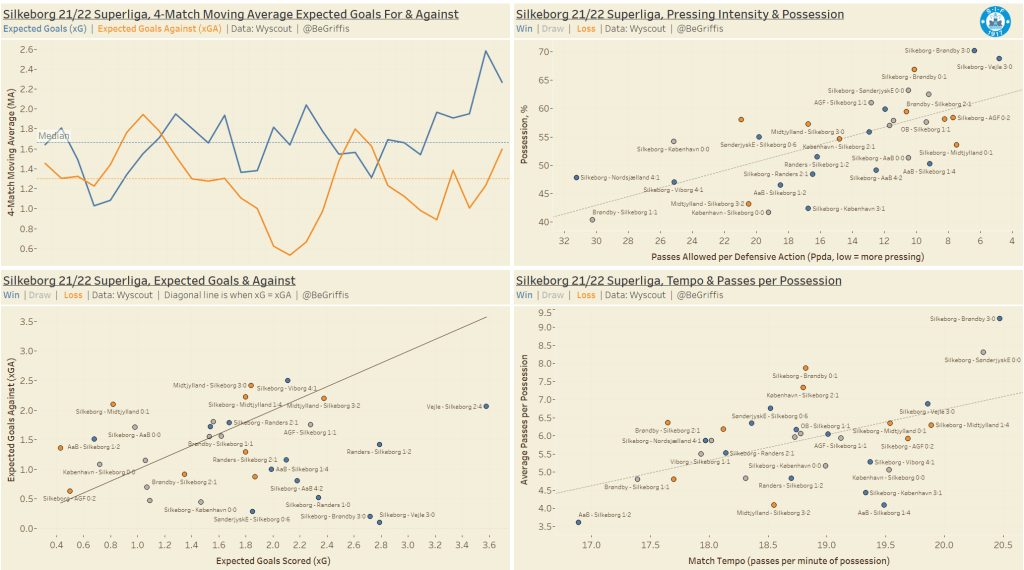
Silkeborg’s moving average xG was typically larger than their xGA for the majority of the season. The club even improved their xG throughout the Championship Group, something that I pointed out earlier as being difficult. Their xG remained relatively constant across the season outside of an early dip and the late season improvement, but they were good at decreasing their xGA throughout the regular season and then again at the end of the Championship Group. That strikes me as being the most impressive feature of their moving average chart. If they can keep a similar trend into next season, they will be a danger yet again.
However, with Europa League playoffs and possibly the Group Stage adding in more games early on in the season, it could be difficult for them to keep up last season’s performances while having many more games than the club is used to having.
The club were also relatively good at turning games with negative xGD into victories, winning 4 of them. However, they evened this out by losing 4 games with positive xGD, so we can probably say they did play as expected. This is also backed up by them scoring 54 goals off 54.5 xG. Their defense shined, though, conceding just 37 goals from 41.7 xGA. This was not the league’s best, but for a newly-promoted Superliga side, it is impressive.
We don’t see anything that stands out from their PPDA/possession graph, at least in terms of patterns. We can see they had a few games where they pressed very intensely, but the majority were about average, at between 10-20. In fact, Silkeborg recorded the highest average last season of any of the 22/23 Superliga clubs, with 14.7. Copenhagen come 2nd, with 12.0. That tells us Silkeborg should probably be the least-pressing team this season, as both Lyngby and Horsens, the promoted teams for 22/23, had much lower average PPDAs (around 10).
Silkeborg did have the highest average passing tempo last season, though, so while they may not press often at all, they certainly move the ball around quickly when they have it. They also recorded the highest average possession, so not only do they move the ball around the pitch quickly, they also dominate possession in most of their games. Manager Kent Nielsen has obviously decided the key to pushing his team to the next level is to allow the opponent to have the ball in their half, but then try to disorient them with quick ball movement and lots of it. They were also effective with their possession, taking the 2nd-most shots per game on average and ending 27.9% or their attacks with shots, the 3rd-best in the league.
With few transfers in or out so far, we should expect Silkeborg to be at the top end of the table yet again, barring any major fatigue issues caused by a possible Europa League run. They also didn’t over-perform their xG at all, so there’s not much in their data indicating that their performances this season are unsustainable. They should be a team to watch again next season.
21/22 Formations
Silkeborg were incredibly consistent with their formations last season. They only played in 3 formations, with a 4-3-3 being used 60% of the season, a 4-2-3-1 for 33%, and hardly a 4-3-1-2. Again, with few transfers and no change in manager, we should expect Nielsen’s 4-3-3 with a 4-3-2-1 rotation again.
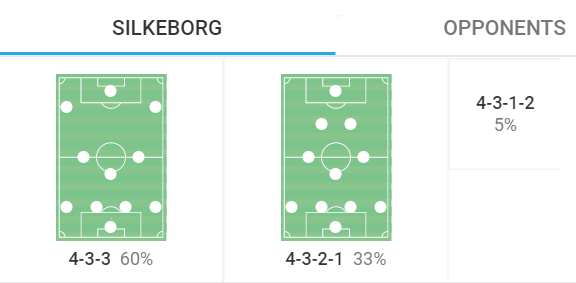
Silkeborg deployed their 4-3-2-1 in their lone pre-season friendly this season, a 2-1 loss to Brøndby.
Key Players
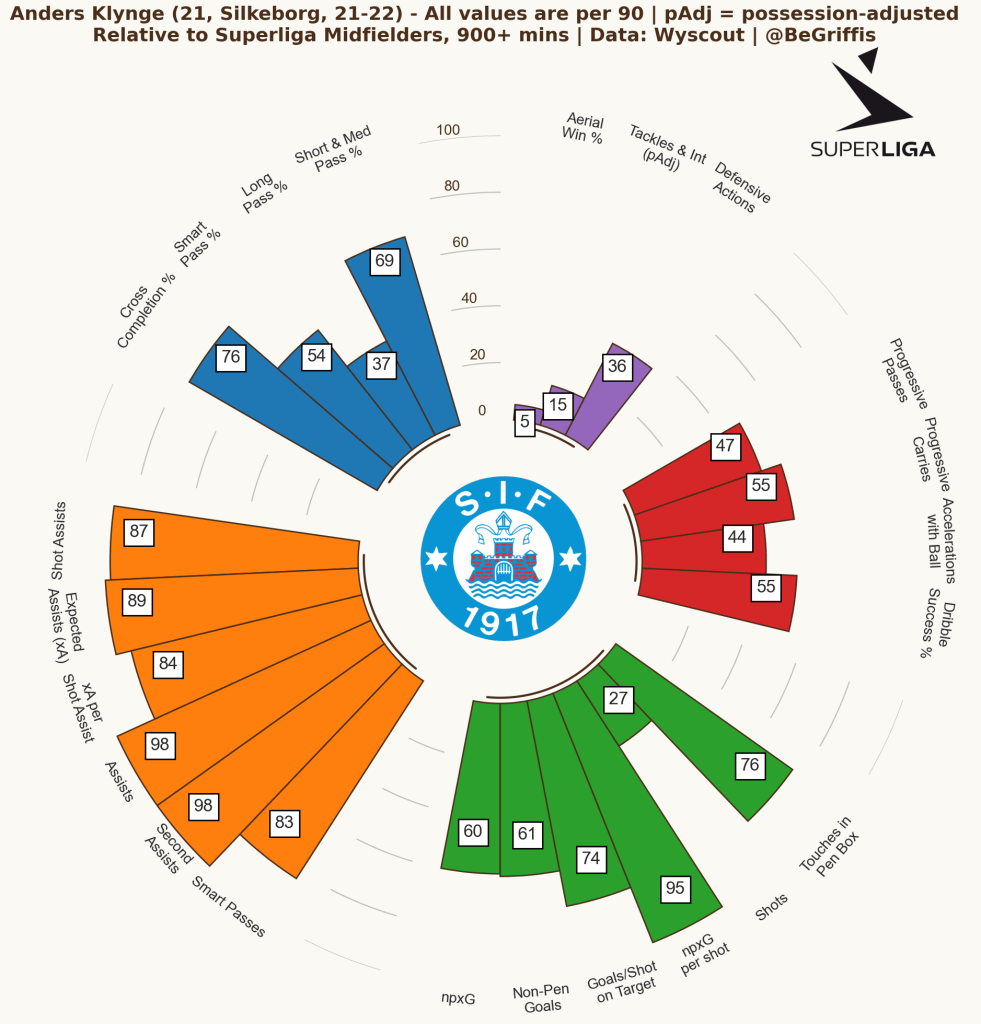
Silkeborg were blessed with assists. 4 of the top 10 assist-giving players were Silkeborg players. AaB and Midtjylland were the only other teams with multiple players in the top 10, with 2 each. Anders Klynge was one of these players, making 5 assists but being extremely creative in more than just assists. He facilitated Silkeborg’s attack, with many smart passes, shot assists, and a very high xA per shot assist. That last metric, xA per shot assist, shows how dangerous his passes leading to shots are. Further, hhs recorded one of the highest xG per shot (non-penalty) for midfielders. His passing and shooting decisions are some of the best in the league.
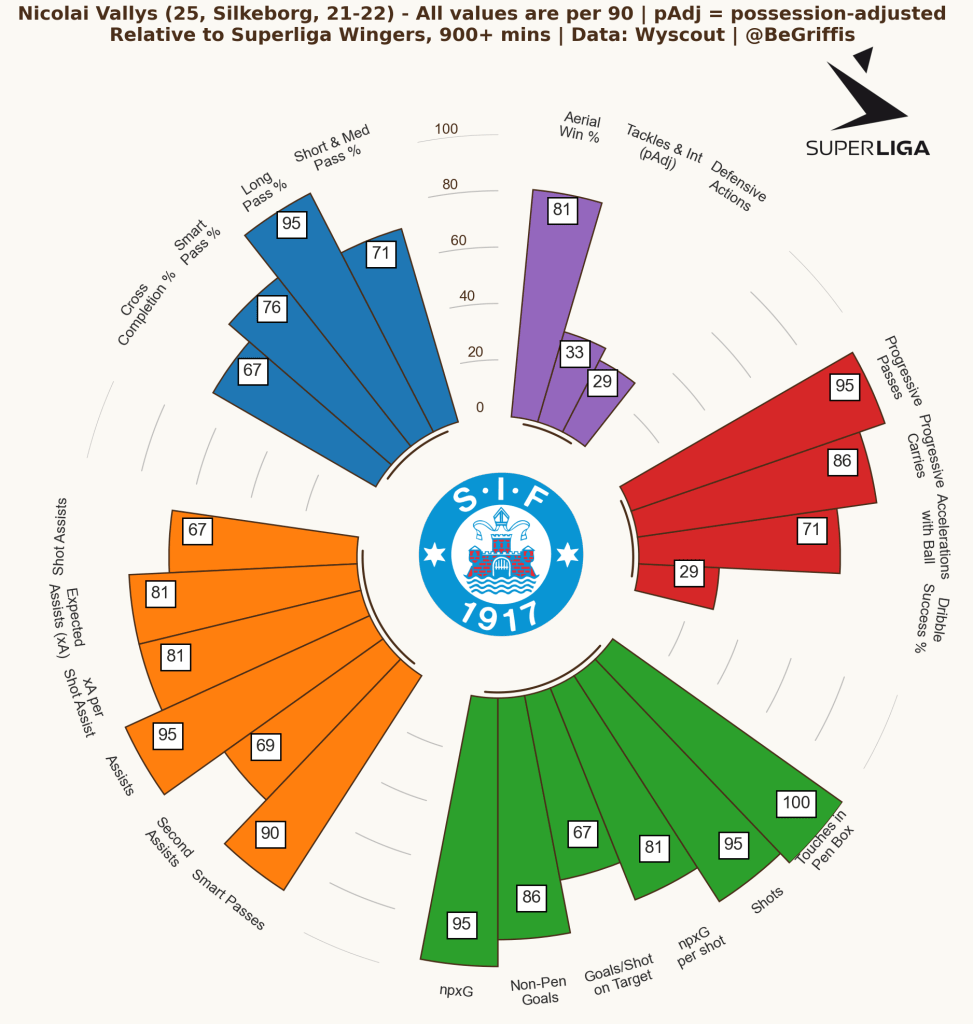
Another vital player to Silkeborg was left winger Nicolai Vallys. One of the top wingers in the league, he was very good at passing, creativity, goal scoring and shooting, and progression. He’s also not too bad at winning aerial duels. His contribution from the left flank was key for Silkeborg and being just 25, we should expect him to be at least as good next season as well.
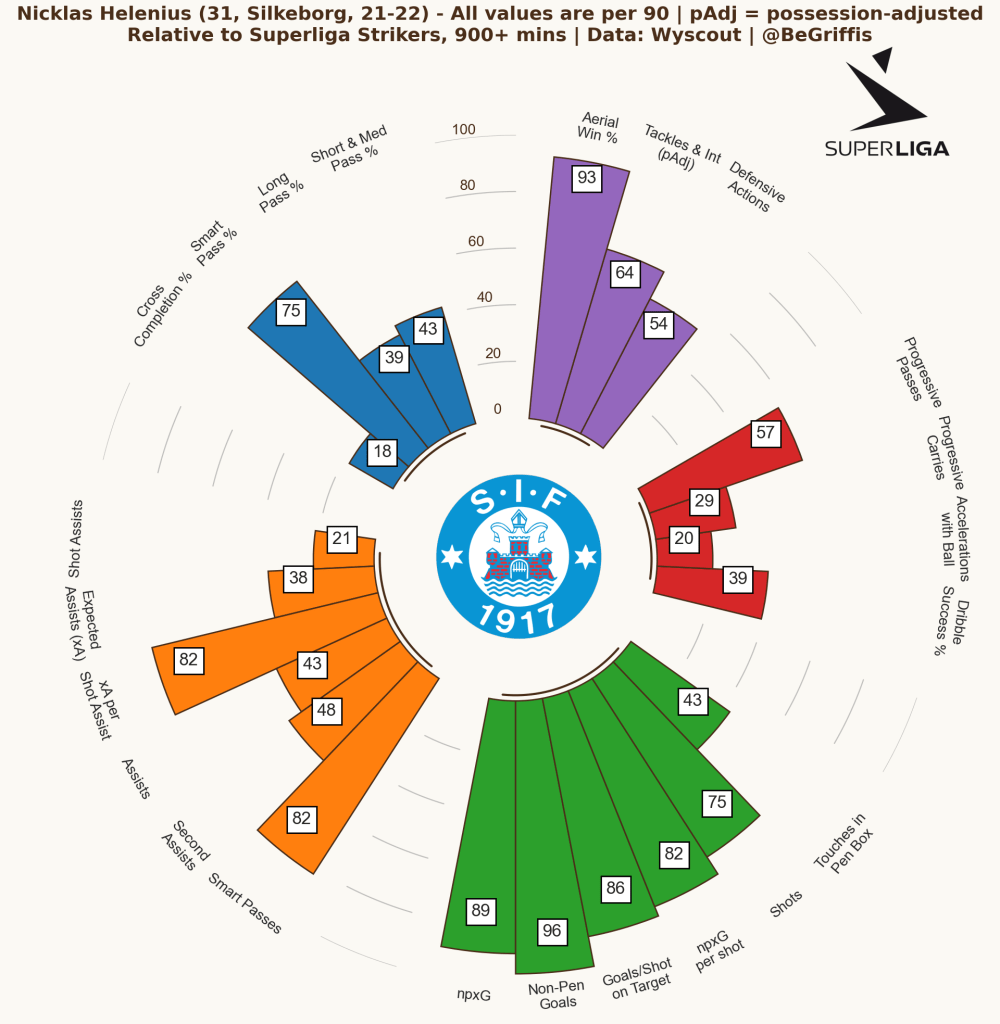
And finally, we can’t forget the league’s top scorer, Nicklas Helenius! 17 goals from 13.5 xG. A goal almost every 4 shots too, very impressive. This was his best season in his career in terms of goals scored, beating his personal best of 16 with AaB in 2012/13. He scored 1 more goal this season with about 400 fewer minutes as well. The only downside, however, is that he did over-perform his xG by a decent margin and hadn’t scored more than 10 goals since 2016/17, so we probably shouldn’t expect so many from him next season. Although, with continued great service from his wingers and midfielders, it’s not unrealistic for him to notch 15+ again.
Brøndby IF
21/22 Data Review
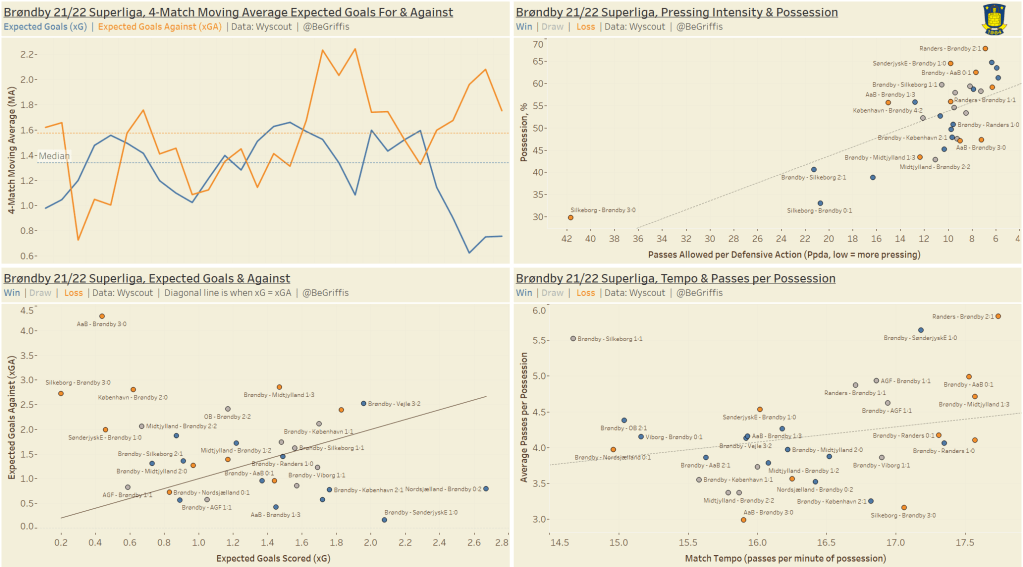
Brøndby didn’t have the title-defending season they would have liked, finishing 4th and starting out the season poorly, winning their first match in round 7. However, after that they went undefeated from round 10 to 21 before finishing the Championship group only winning the final 2 matches and recording a 2-2-6 W-D-L record. Their moving average xG and xGA show how difficult the end of the season was for them, but it also shows how close many of their matches during their undefeated run were. xG and xGA followed each other fairly well during this time, with a decent stretch of negative moving average xGD matches. An interpretation we can make from this info is that Brøndby’s results during their unbeaten stretch may have been relatively vulnerable to easily turning into losses.
With that in mind, we can look at Brøndby’s xG & xGA per match chart in the bottom left. They were very good at turning negative xGD games into victories, winning 5 they were expected to lose. A 5-5-8 record in negative xGD matches is admirable, but what’s not admirable is the sheer number of games where their xGA was greater than their xG. That’s a key area for Niels Frederiksen to work on ahead of the new season. While they may have been good at winning those games, they would be better suited having fewer of them, of course (that’s not a novel analysis either!). They only lost 2 games they were expected to win, so an improved defense would be important going forward.
The PPDA & possession chart clues us into Brøndby’s style. They had the lowest median PPDA of all Superliga teams (I use median here to exclude the skewing effect of that Silkeborg match), showing that they like to press and press often.
Brøndby were also fairly average compared to the rest of the league in terms of their match tempo and passes they strung together per possession. They were very consistent with their tempos, however, game to game. Most matches had between 16 and 17.5 passes per minute. One thing to note here is that they did tend to lose more matches where they had a relatively high tempo, losing 6 of the 8 games where they made more than 17 passes per minute. This of course is not causal, as it could be that many of these games involved them chasing the game trying to score while down by 2 or 3 goals.
Overall, there’s plenty of room for improvement for Brøndby next season. After winning the title in 20/21 they were then well off the pace of Copenhagen and Midtjylland this season, finishing 20 and 17 points behind them respectively. They scored the exact amount of goals Wyscout’s model predicted them to score, 40, and conceded 8 fewer than expected. However, of the teams competing in the 22/23 season, only AGF had less xG last season. Frederiksen will need to address his team’s ability to create goal-scoring chances. Finishing 4th but with so few expected goals and with a large over-performance in expected goals against spells danger for next season if he doesn’t address this problem.
21/22 Formations
Brøndby used several different formations last season, albeit typically slight tweaks on their main formation of 3-5-2. Frederiksen typically employed a back 3/5, but rotated into a back 4 near the end of the season.
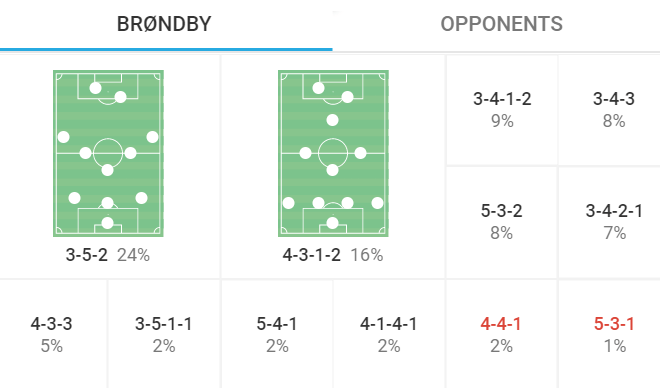
I would expect Frederiksen to play a 4-3-1-2 most of the season given that that’s how he ended the season, that’s how he lined up in their pre-season match against AGF, and that allows him to play a combination of Simon Hedlund, Mathias Kvistgaarden, and Marko Divković in their preferred striker role. They also don’t have any players who are extremely prolific as attacking wingers, so I expect the 4-3-1-2 at least at the start of the season.
Key Players
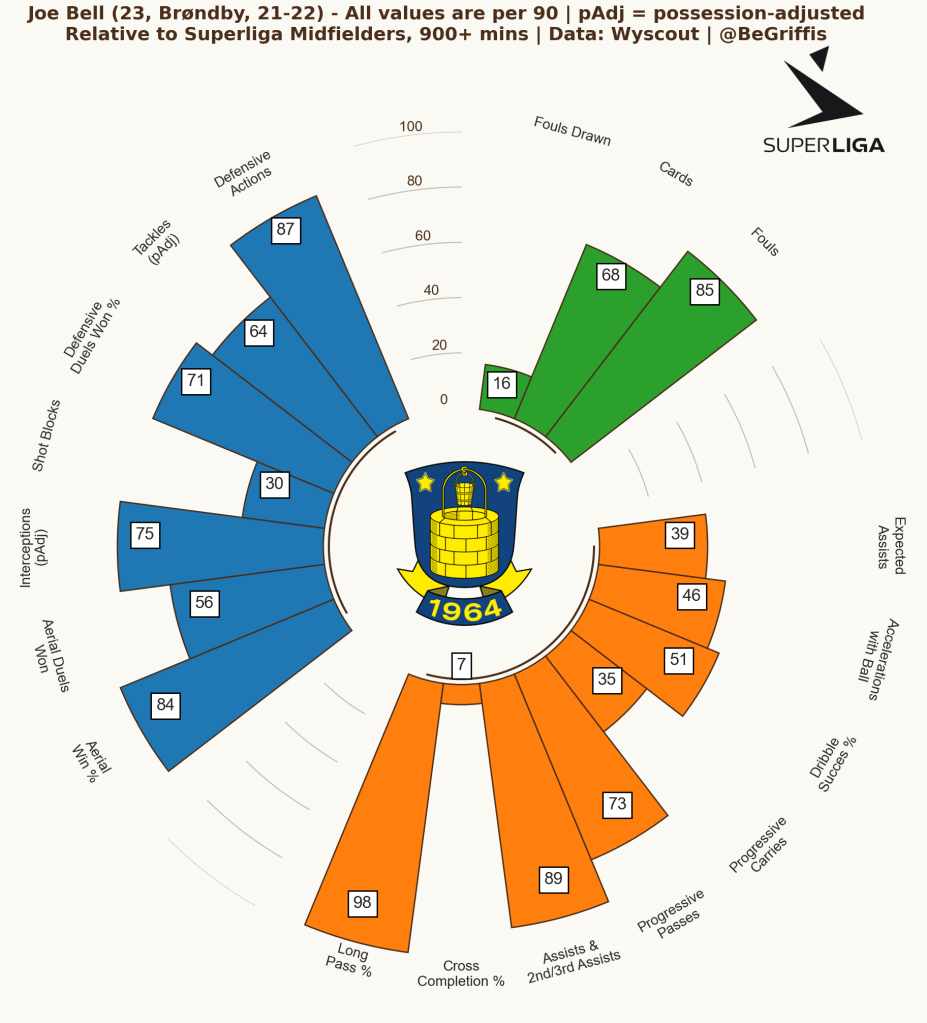
Three players I think will be key for Brøndby next season: Midfielders Joe Bell and Christian Cappis, and right back Andreas Bruus.
Joe Bell was very important as a defensive midfielder after moving from Viking in Norway to Brøndby in February. This radar below is more defense-focused, showing his strong ability sitting in front of the back line. Note that fouls and cards are a reverse axis, so being 85th percentile for fouls committed means he committed very few fouls per 90 minutes compared to other midfielders. He’s also a tidy passer with good vision, shown by being one of the best long passers from midfield and being heavily involved in goal scoring chains, at the 89th percentile for 2nd & 3rd assists per 90.
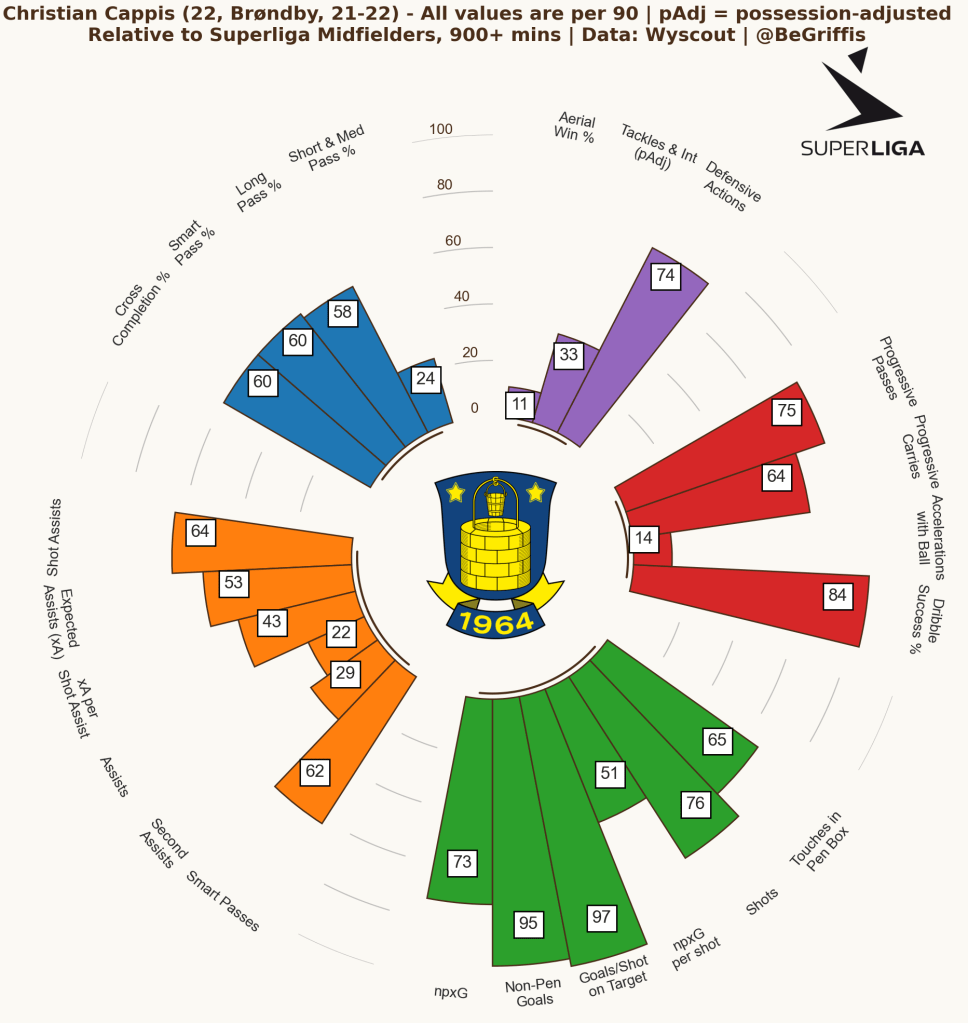
While Christian Cappis might not be a nailed-on, vital starter for Brøndby, I have to include him as a biased American Brøndby fan………
Cappis may not be the most reliable midfielder in defense (compared to all other midfielders with at least 900 minutes, his defensive duel win % is very average), but he is a decent goal threat coming out of the midfield, important to Brøndby’s ball progression up the pitch when he plays, and a relatively tidy passer with a little penchant for trying a few high-risk high-reward passes as well. Being just 22, if he can get some more consistent playing time next season he could continue to improve and possibly make a case for being a nailed-on starter with Joe Bell and Anis Ben Slimane. He played about 40% of the minutes he was available for in the Superliga last season.
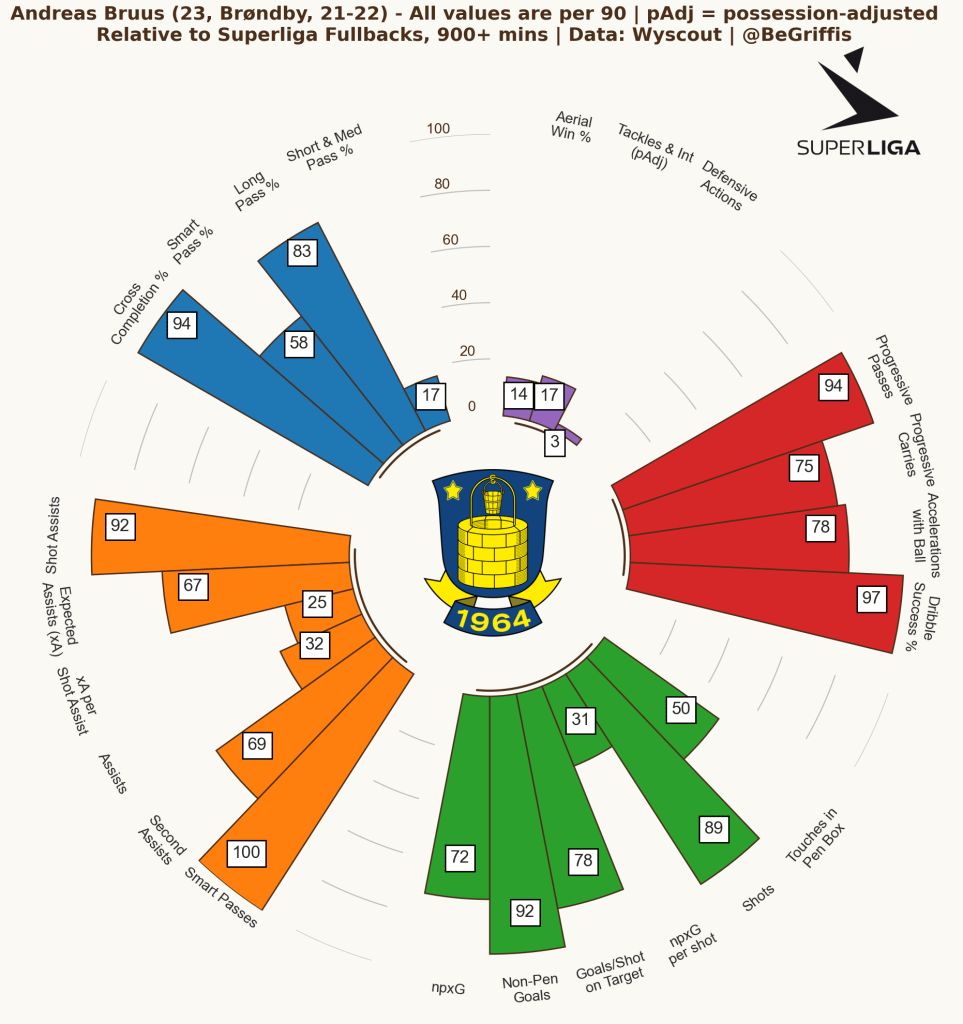
A third player that could be key next season is right back Andreas Bruus. While not the best fullback defensively, he was one of the most dangerous fullbacks going forward last season. Brøndby struggled to create chances last season, so Bruus should be an important player down the right flank next season. He was one of the best fullbacks in crossing, creating shots, and trying risky defense-splitting passes. These numbers are partially due to Brøndby focusing play down the right fairly often, but in many games the team attacked down both wings fairly evenly. However, most of Brøndby’s xG was usually generated from the right flank much more than the left flank. Bruus keeping up his performances next season but with a slightly asymmetrical attacking focus could help Brøndby improve their xG, something that I called out earlier as being a main area for improvement.
Overall, Brøndby may have had a disappointing season, but given Niels Frederiksen’s ability, I think we should expect them to improve. Losing top-scorer Mikael Uhre mid-season was definitely a blow to their attack and it will be interesting to see if they can bring their xG up to levels seen with Uhre. In matches with Uhre the team averaged 1.31 xG, but without him they averaged 1.18 xG. They also averaged 1.47 goals per game with Uhre but 1 goal per game without him… Brøndby’s defense performed well, but their attack certainly lacked that extra bit of quality to bring them to Copenhagen and Midtjylland’s level. The first few matches could be important indicators of the work done this off-season to improve in this aspect.