
Article by Ben Griffis
Goalkeeper chains are one of the fastest-growing tactical trends around the world, at all levels of the game. Goalkeeper chains are, at a basic level, the goalkeeper being heavily involved in their team’s buildup, usually just outside their box (or in some extreme cases, much higherup), in order to create numerical overloads. For a more detailed discussion on the tactic, please read Neel Shelat’s brief introduction piece for Analytics FC, his in-depth follow-up with a host of examples, or for German speakers, René Marić’s seminal piece (which you can grasp the idea via the images).
I’ve loved this idea since I first discovered Christian Titz’s Magdeburg during their 21/22 3. Liga promotion-winning campaign. Titz instructs his keeper, Dominik Reimann, to push up as essentially the middle center back in buildup, often close to the center circle.

Naturally, as I tend to do with anything I find interesting in football, I decided to figure out how we can use data to find the teams who might use their goalkeeper most frequently in buildup.
The Data
My data for this all comes from Wyscout. And in fact, the data for this article is just one step in my process to create my team & player similarity package that I’ve posted on my GitHub.
The first step is to download the data. I grabbed 175 leagues from Wyscout (2023 or 23/24 seasons), including essentially every possible 1st & 2nd tier senior domestic league competition, and going down to leagues like the 6th tier in England (National League North/South), 4th tier in Spain (Segunda División RFEF), the 4th tier of South Korea (aptly named K4), and much more. I included a few youth leagues, namely MLS Next Pro and Kazakhstan’s new U18 league that I’m confident in the data quality/coverage (I’m unsure about some leagues in Wyscout, and others have sporadic coverage), and also didn’t include leagues like Brazil’s State Leagues, which are available but are essentially double-counting teams as many are covered in the top 3 tiers already included.
There are some exclusions if the leagues are not in Wyscout, and one league I have to mention for this article… South Africa’s top tier is not in Wyscout this season, meaning Rulani Mokwena’s Mamelodi Sundowns are not included in this (they would almost certainly rank quite high).
This gives us 2,981 teams to work with. Not too shabby of a sample size!
The final step to preparing the data is to get team values per 90 minutes. The Wyscout output is every single player in these leagues, so I calculate the total number for each metric (instead of per 90), sum them up by team, and then convert back to per 90′ for each team based on the sum of all minutes their players have played this season.
The Variables
The next step is to decide how to come up with this metric, which I’ll creatively title “GK Buildup Index”. Wyscout sadly does not have the average distance from the goal a player is when they make or receive a pass, so we won’t be able to include any level of detail into if a team uses their goalkeeper exceptionally high up or inside their box.
However, as I’ve watched for teams all over who use their goalkeeper heavily in possession, often times teams using their GK more tend to push them out of the box with some regularity. Even if that’s just at the top of the box, they are further out than GKs on teams who don’t utilize them in buildup that often. I think this is pretty logical as well, as the essence of using a GK fairly regularly in buildup is to have them be more available for passes than normal, which means pushing them closer to the defensive line (or into it, in extreme cases like Magdeburg and one we’ll get to later).
The variables I decided to use for this metric are:
- Number of passes the GK attempts per 90′
- The % of a GK’s passes which are not forward
- The % of a GK’s passes which are not long
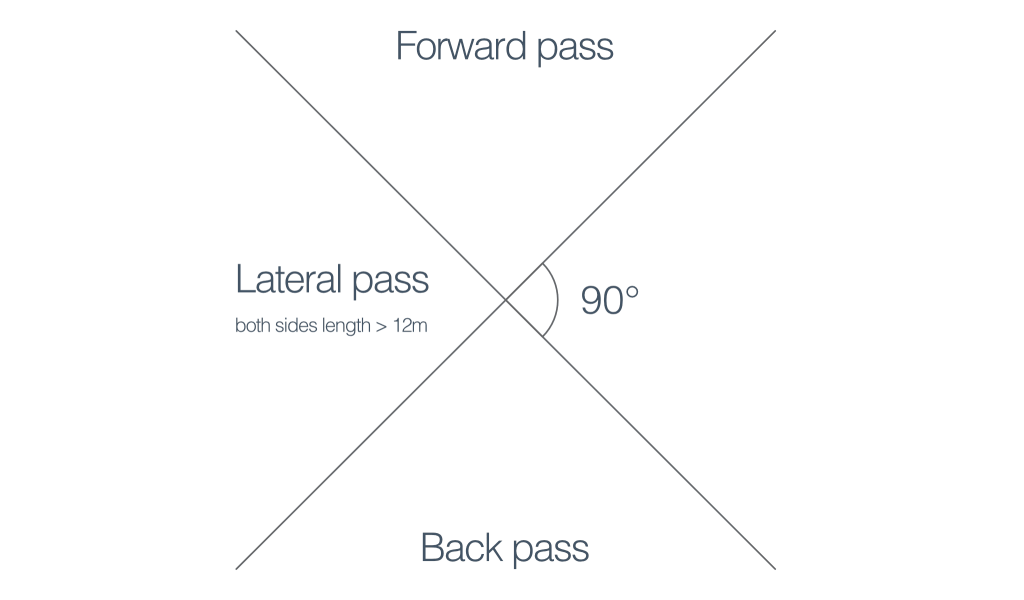
Wyscout codes a “long pass” as a ground pass longer than 45 meters, or an aerial pass longer than 25 meters, and a “forward pass” as a pass, when oriented with the opposition goal straight ahead, between 45 degrees to the left & right. Please see the image below for a much better description.
There aren’t many more metrics to choose from in Wyscout anyway, so while it’s useful to keep models simple to begin with (as long as they still do the trick as a more complex one), Wyscout’s limitations here also forces simplicity.
I’d also like to note that some teams who certainly don’t use their GK in buildup at all can see their GKs record fairly high passes per 90′, often long boots down the pitch to a tall striker more often than not named “Chris Wood”, “Christopher Wood”, or something similar. Jokes aside, these are not GKs we want to score high in our metric, so the addition of two other variables that they will likely score low in really helps.
The Model
Since number of passes per 90′ and percentages are on different scales (percentages are bound 0 to 100, while there’s no theoretical limit to passes per 90′ although none will ever get near 100), we need to manipulate the variables in order to get them onto the same scale. We have to do this so that we can compare, contrast, combine, etc. these different variables.
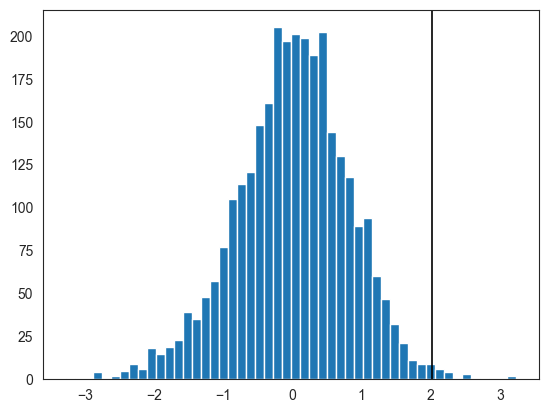
I love z-scores, and chose to convert each variable to a z-score compared to all other players in the sample. Z-scores are effectively a numerical representation of where a number is on that metric’s distribution, in standard deviations. The image below, taken from Wikipedia, highlights the necessary info in blue.

Z-scores retain critical information inherent in a variable: its distribution. And when we want to combine or compare different variables on different scales, we retain the necessary information while putting all variables on the same scale. For more info and visuals about z-scores for metrics, please see one of my older articles.
The next step after transforming our variables into z-scores is to figure out how to make the metric. There are a few ways to do this, including harmonic mean of the variables (something I’ve done before and love), a weighted average where we assign relative importance levels to each variable, a regular average (arithmetic mean), or something more complex. I chose a regular average, where we take the sum of the 3 metric’s z-scores and then divide by 3. The reason for this is that I think all 3 variables are important for goalkeeper chains and assigning relative importance here would be unfair to some tactical nuances. Perhaps in the future I can examine this closer and maybe interview managers who employ GK chains to come up with a better method.
The average of each team’s z-score is thus their GK Buildup Index score. The final step is to normalize all GK Buildup Index scores, so that we can easily compare teams. I normalize all scores so that the top score becomes 100, and the lowest score is 0. It’s much easier to compare teams that have scores of 100 and 95 and 94.3 than ones than have 3.57845 and 3.4673 and so on. This will still retain the distribution of non-normalized scores and th relative distance between 2 teams will be the same, but it’s so much easier to interpret.
The Results
So, who are the teams with the highest GK Buildup Index scores?
Perhaps unsurprisingly, Christian Titz’s Magdeburg ranks on top. This also tells me the metric is probably decent, as if they didn’t make the top 20 I’d have serious questions! The Top 20 teams are in the table below.
| Team | League & Season | GK Buildup Index |
|---|---|---|
| Magdeburg | 2. Bundesliga 23-24 | 100 |
| Young Boys | Danish 3. Division 23-24 | 98.07 |
| YSCC | J3 2023 | 92.08 |
| Fortuna Düsseldorf | 2. Bundesliga 23-24 | 91.48 |
| Schalke 04 II | Regionalliga 23-24 | 89.77 |
| New York City II | MLS Next Pro 2023 | 89 |
| Hamburger SV | 2. Bundesliga 23-24 | 88.96 |
| Nordsjælland | Superliga 23-24 | 84.76 |
| Phoenix Rising | USL Championship 2023 | 84.31 |
| Albirex Niigata | J1 2023 | 84.15 |
| RB Leipzig | Bundesliga 23-24 | 84.12 |
| HB Køge | Danish 1. Division 23-24 | 83.67 |
| St. Pauli | 2. Bundesliga 23-24 | 83.64 |
| Atlante | Liga de Expansión MX 23-24 | 83.51 |
| Leicester City | Championship 23-24 | 83.37 |
| Brisbane Roar | A-League Men 23-24 | 83.06 |
| Lanús Res. | Argentina Reserve League 2023 | 82.16 |
| Sagan Tosu | J1 2023 | 81.71 |
| Tobol Res. | Kazakh 2. Division 2023 | 81.44 |
| Gold Coast Knights | Queensland NPL 2023 | 81.34 |
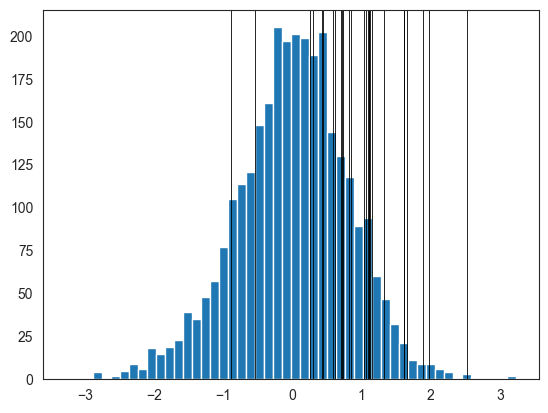
The image below shows the distribution of all GK Buildup Index scores, for every team in the sample, and the black line is #20 above, Gold Coast Knights, to give you a reference point. Magdeburg & Young Boys are the only teams with unadjusted index scores above 3. But we can see the normal distribution centered around 0. Again, these are non-normalized numbers; the final index score is simply normalizing these 0-100.
The Discussion
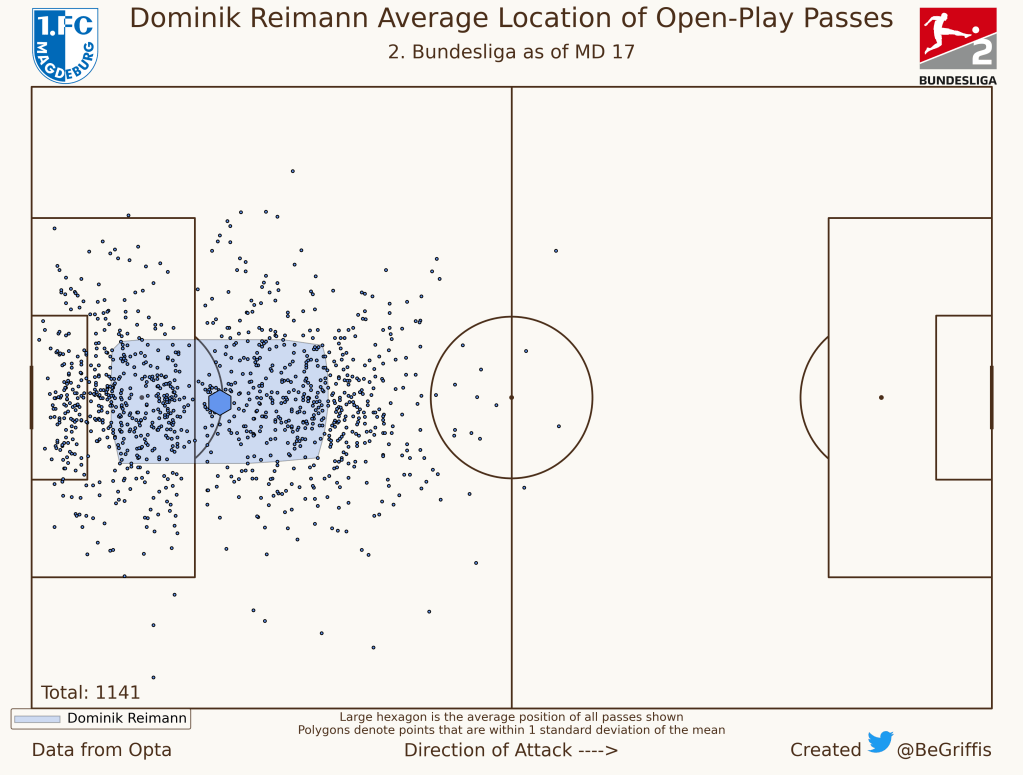
Naturally, Magdeburg rank #1. At the beginning of this article, we saw one image of Reimann in the back line. Below is a graph showing all locations of Reimann’s open-play passes this season. Look at the massive concentration of passes midway between the box and the center circle… it’s not a fluke!
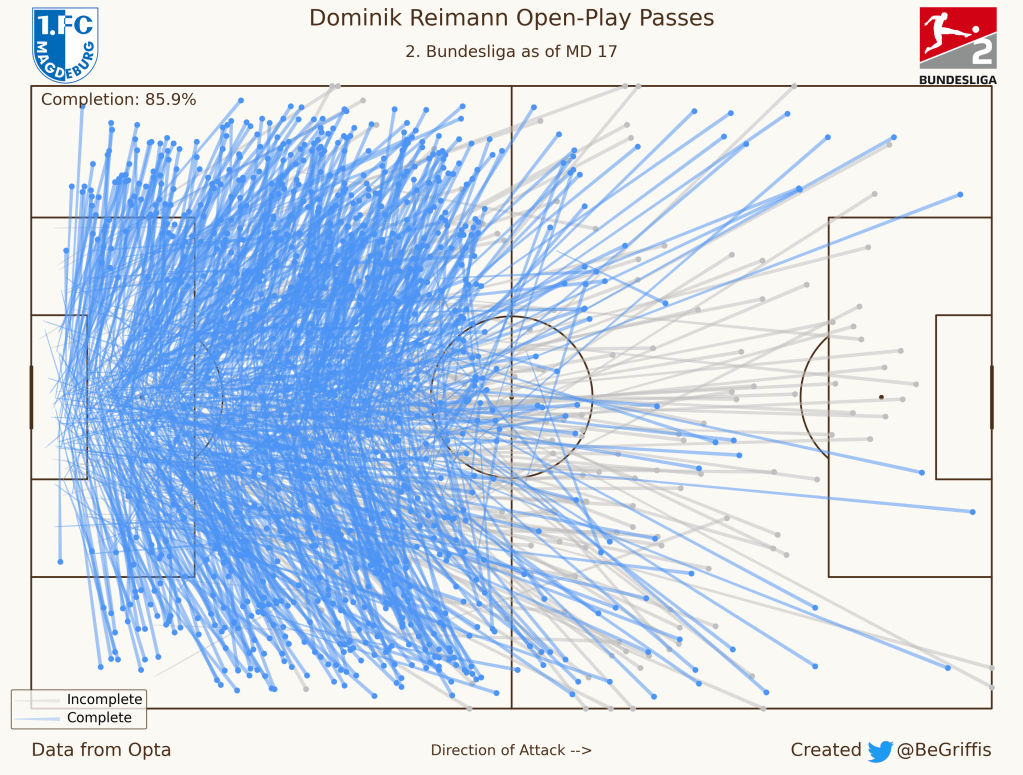
And here are Reimann’s open-play passes. It’s incredible not just how many passes he plays, but where they come from and how lateral they are. Reimann is a vital cog for Magdeburg’s buildup, sitting between or just below the center backs, spreading play to help them create gaps in the opposition defensive structure or outnumber their opponents centrally or on the flank.
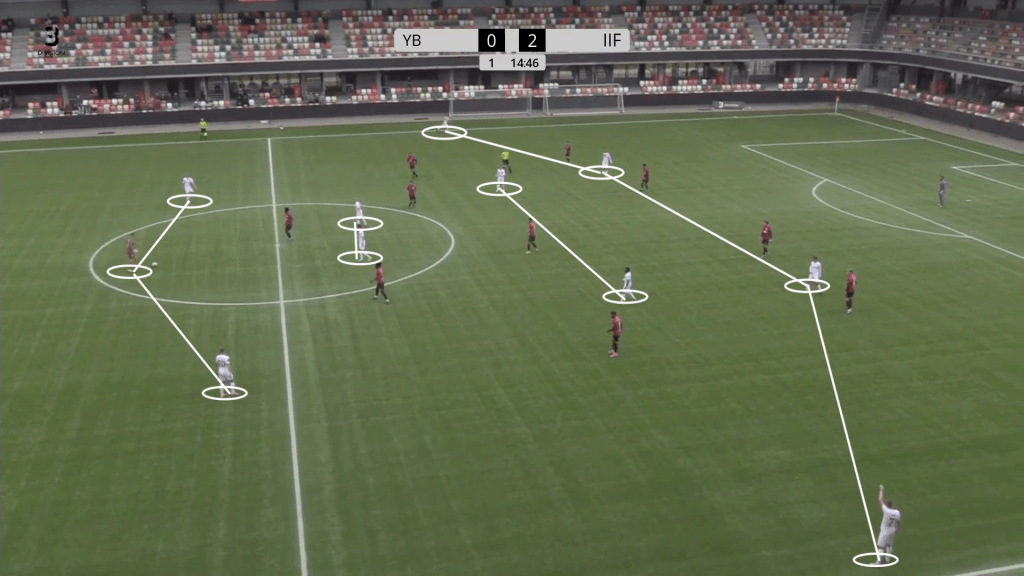
Perfect, well how about #2? Never heard of them? Neither had I until I starting playing around with using data to identify teams like this. But let me make your day a little bit brighter by introducing you to them… see my thread on Twitter below for more info, but here is an image of Daniel Sehested’s Young Boys, in the 4th tier of Denmark. they form a 3-2-2-4 in buildup by utilizing their GK as a CB. Fascinating stuff.
As we get further down the list, teams such as RB Leipzig, Phoenix Rising, Sagan Tosu, etc. use their GK a lot in buildup, but not nearly as high as Magdeburg and Young Boys and Hamburger SV.
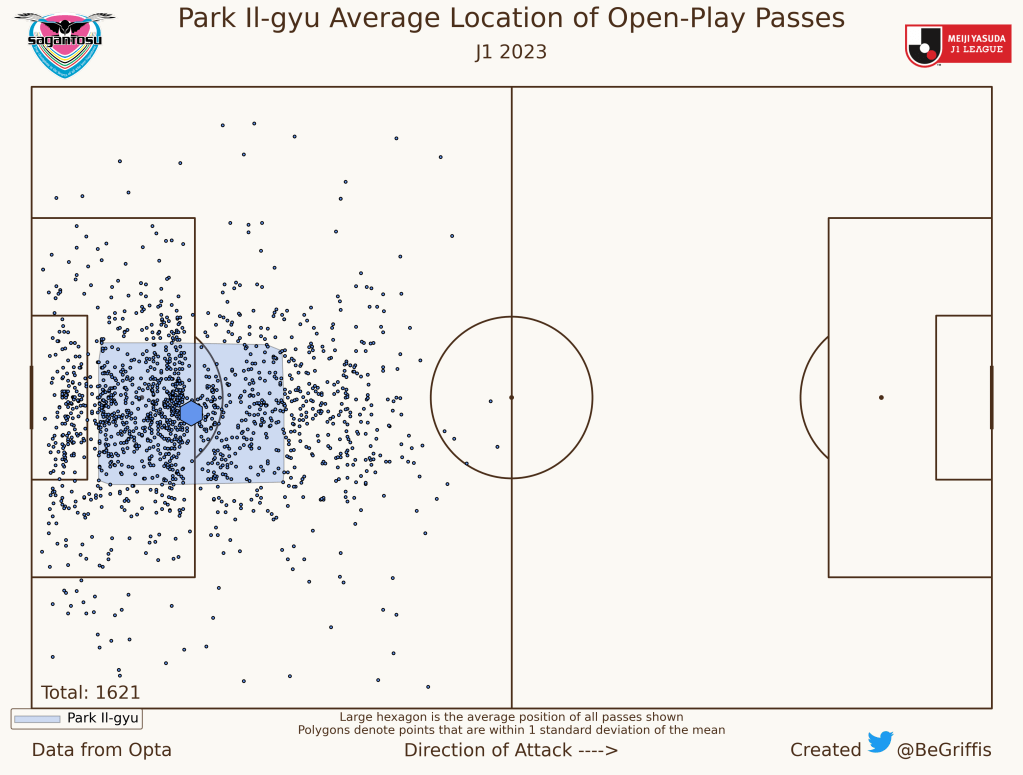
For example, here is Sagan Tosu’s GK Park Il-gyu’s open-play pass locations. They rightfully rank high in this metric, but don’t push Park nearly as high up, as frequently, as Magdeburg do.
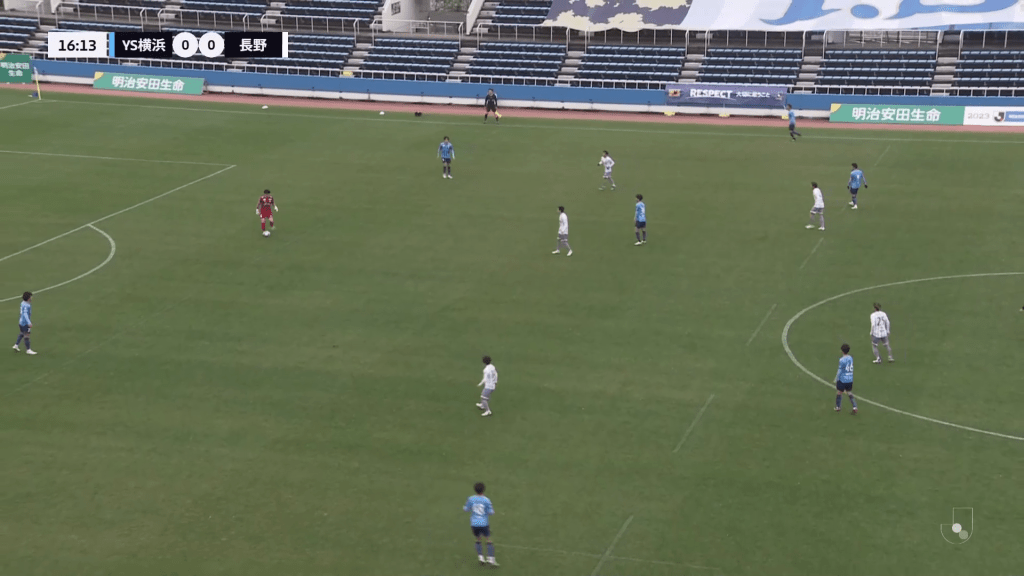
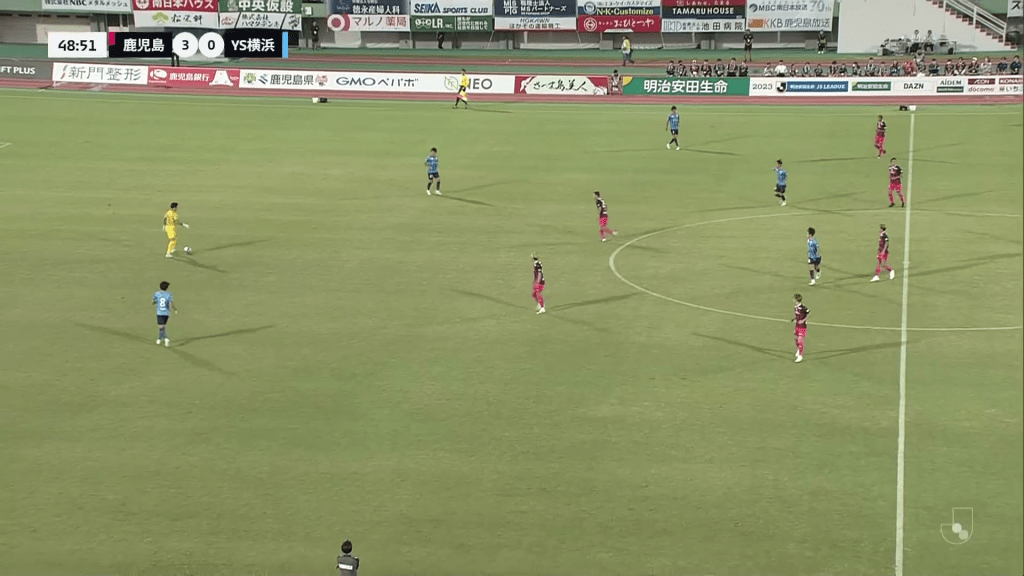
Compare that to YSCC in J3, who rank 3rd in the GK Buildup Index. More passes and a higher frequency of passes higher up the pitch. I’ve also included 3 images of YSCC’s Jun Kodama below.


Of course, these are just the top teams. What about the average teams and lowest teams? How do they look? We need to see something to compare.
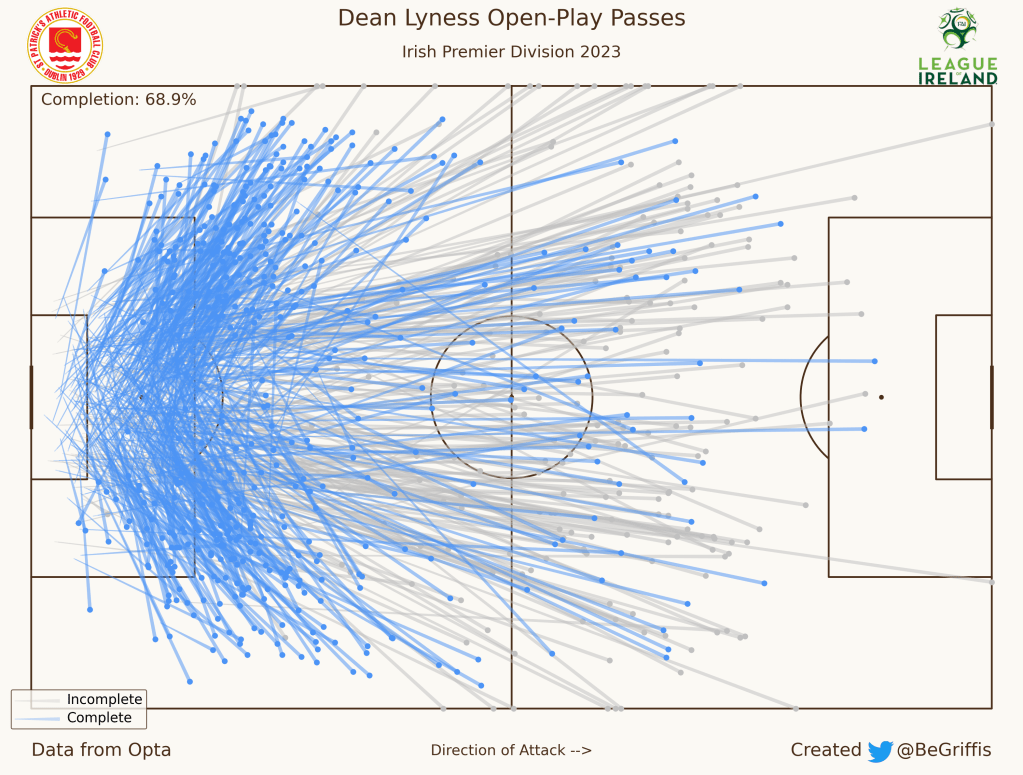
St. Patrick’s Athletic of the Irish Premier Division are one of the “most average” teams, with a non-normalized GK Buildup Index of 0.020, which is equal to 50.68 in the 0-100 normalized score. Below is their main GK Dean Lyness’s open-play passes.

We can see Lyness has a few passes outside his box, but not that many. Compare this to Reimann’s above. The majority are inside the box, and as we see below, there’s a good mix between long passes (many incomplete) and short passes (many are complete, to his CBs).
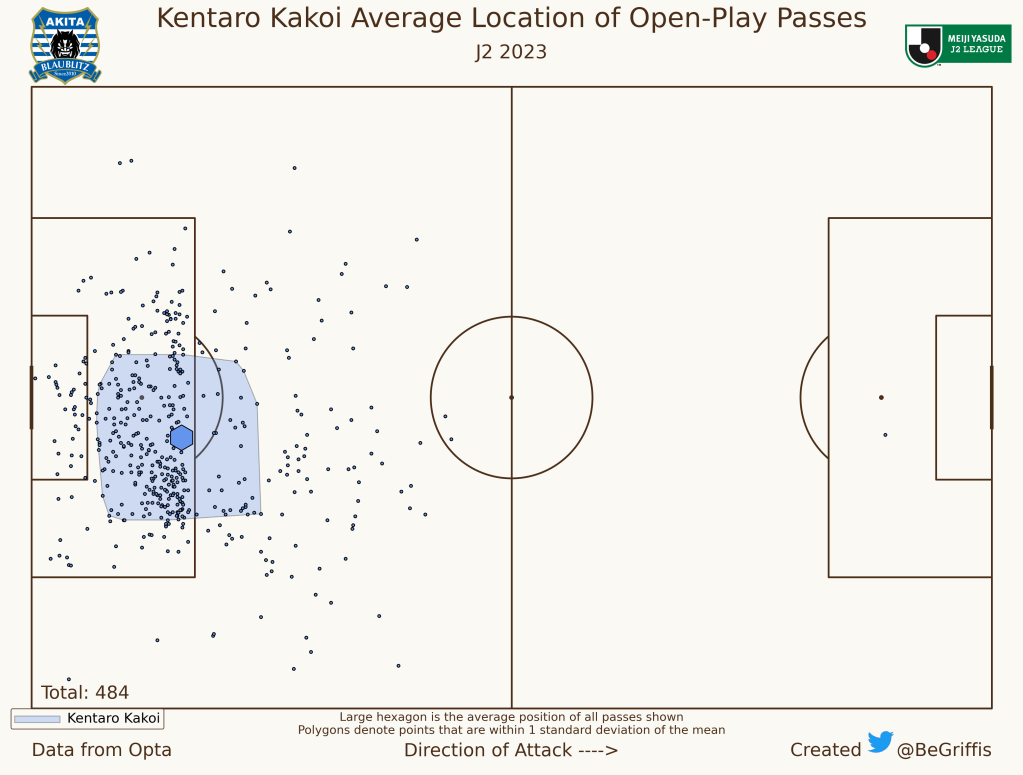
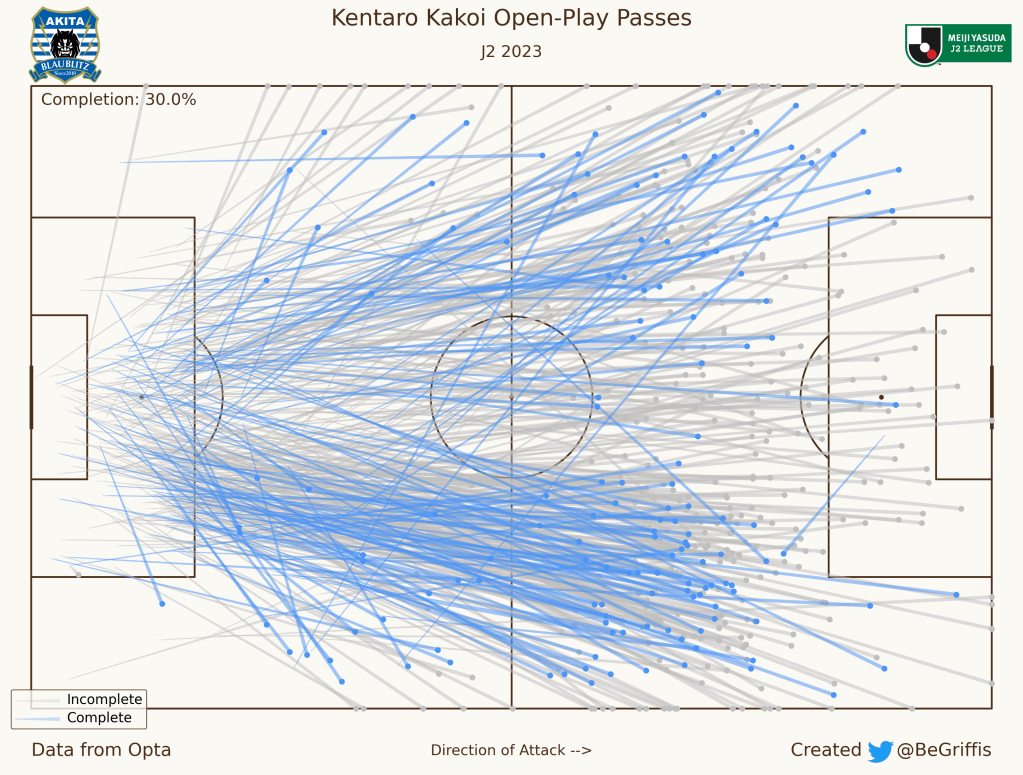
On the opposite end of the spectrum from Magdeburg, ranking dead last in GK Buildup Index, we have one of my favorite teams: Blaublitz Akita. This interesting defensive team had very low possession (38.8%), which will decrease the number of passes their goalkeeper can make. However, when playing passes, Kentaro Kakoi almost exclusively booted it long, leading to an open-play pass completion of just 30%!
Below are the bottom 20 teams by GK Buildup Index. It’s funny that there is a J1 club in both the top and bottom 20.
| Team | League & Season | GK Buildup Index |
|---|---|---|
| Vänersborg | Ettan 2023 | 15.83 |
| Villalbés | Segunda RFEF 23-24 | 15.43 |
| Boreham Wood | English National League 23-24 | 15.39 |
| Oţelul | Romanian Superliga 23-24 | 15.23 |
| Avispa Fukuoka | J1 2023 | 15.15 |
| Stranraer | Scottish League Two 23-24 | 14.4 |
| Drogheda United | Irish Premier Division 2023 | 14.33 |
| Tamworth | English National League N/S 23-24 | 14.03 |
| Cercle Brugge | Belgian Pro League 23-24 | 12.91 |
| Alfreton Town | English National League N/S 23-24 | 12.68 |
| El Gounah | Egyptian Premier League 23-24 | 12.52 |
| Carrick Rangers | Northern Irish Premiership 23-24 | 12.36 |
| Redlands United | Queensland NPL 2023 | 12.16 |
| Newport County | League Two 23-24 | 11.58 |
| Maidenhead United | English National League 23-24 | 11.06 |
| Farnborough | English National League N/S 23-24 | 7.95 |
| Taunton Town | English National League N/S 23-24 | 7.95 |
| Deportivo Riestra | Argentina Primera Nacional 2023 | 7.87 |
| Bala Town | Welsh Premier League 23-24 | 7.59 |
| Blaublitz Akita | J2 2023 | 0 |
I’ve uploaded an interactive, searchable table of every team’s GK Buildup Index on DataWrapper.
Expansion: Ranking Leagues by GK Buildup Index
Since we have the data for teams, it’s easy to create a league-wide GK Buildup Index. This is just a simple average of all teams’ GK Buildup Index scores, and then normalized again so that we have the highest at 100 and the lowest at 0. Below is the table for the top 20 leagues.
| League & Season | GK Buildup Index |
|---|---|
| MLS Next Pro 2023 | 100 |
| Veikkausliiga 2023 | 96.26 |
| 2. Bundesliga 23-24 | 95.82 |
| Bundesliga 23-24 | 92.51 |
| Danish 3. Division 23-24 | 91.71 |
| Latvian 1. Liga 2023 | 91.64 |
| A-League Men 23-24 | 89.68 |
| New Zealand National League 2023 | 87.41 |
| Danish 2. Division 23-24 | 87.13 |
| 3. Liga 23-24 | 85.98 |
| Lithuanian 1 Lyga 2023 | 85.93 |
| New South Wales NPL 23-24 | 85.83 |
| Championship 23-24 | 85.65 |
| Estonian Esiliiga A 2023 | 84.14 |
| Austrian 2. Liga 23-24 | 83.63 |
| Swiss Challenge League 23-24 | 83.12 |
| Erovnuli Liga 2023 | 82.76 |
| Danish Superliga 23-24 | 82.47 |
| USL League 1 2023 | 81.92 |
| Armenian Premier League 23-24 | 81.55 |
MLS Next Pro, the league for MLS reserve teams, ranks #1. Teams like NYCFC II, San Jose Earthquakes II, and Columbus Crew 2 all rank in the top 30, and only 2 of the 27 teams rank below average (Philadelphia Union II & New York RB II). Below is the location of every team on the GK Buildup Index distribution.
Finland’s top tier, Veikkausliiga, ranks #2 and none of the 12 teams are below average, with 3 teams in the top 100 (Lahti, Honka, and SJK).
What I found very interesting is to see what countries might place a large emphasis on involving goalkeepers in buildup. This is possible by looking at how high up different leagues in a country rank. Germany’s top 3 tiers all rank within the top 10, with 2. Bundesliga & 1. Bundesliga ranking #3 & #4 respectively, and 3. Liga is #10.
Further, 3 of the 4 Danish tiers in my sample rank within the top 20. The US and Australia both have 2 leagues inside the top 20 (MLS’s reserve league & USL 1, the third tier; Australia’s top tier A-League Men & one of the regional 2nd tiers, New South Wales NPL). Interestingly, the 3 Baltic nations of Estonia, Latvia, and Lithuania all see their 2nd tiers represented.
Below are the bottom 20 leagues by GK Buildup Index. And you can find the interactive DataWrapper table here.
| League & Season | GK Buildup Index |
|---|---|
| Kazakh Premier League 2023 | 41.11 |
| Serbian Super Liga 23-24 | 39.89 |
| China League One 2023 | 39.79 |
| Scottish League One 23-24 | 39.66 |
| Nicaragua Primera Division 23-24 | 38.89 |
| Indian Super League 23-24 | 38.41 |
| K League 2 2023 | 37.38 |
| Egyptian Premier League 23-24 | 35.63 |
| Chinese Super League 2023 | 34.51 |
| Paraguay Division Profesional 2023 | 33.28 |
| Bolivian LFPB 2023 | 33.06 |
| Welsh Premier League 23-24 | 32.23 |
| K3 League 2023 | 32.06 |
| Irish First Division 2023 | 29.58 |
| Northern Irish Premiership 23-24 | 27.3 |
| Scottish Premiership 2023 | 25.68 |
| Argentina Primera Nacional 2023 | 23.78 |
| Honduran Liga Nacional 23-24 | 21.56 |
| English National League N/S 23-24 | 21.26 |
| Scottish League Two 23-24 | 0 |
We see Scottish Premiership & Scottish League Two both in the bottom 5 with Scottish League One, telling us Scottish teams, overall, might not be too keen on their goalkeepers playing with the ball. Scottish Championship ranks as the 40th lowest, and almost 10 points above Scottish League One.
Similarly, K League 2 & K3, South Korea’s 2nd & 3rd tiers respectively, are both in the bottom 20 and K League 1 is in the bottom 30. Chinese Super League and China League One, the top 2 tiers in China, are both in the bottom 20 as well, showing us that these two East Asian nations may not have managers that want their keepers to be involved in buildup much.
On the other hand, Japan sees all 3 of their leagues rank in the top 70, with J1 & J3 in the top 35 (I’m sure Blaublitz Akita is helping to bring down J2 though). So while South Korea and China might not prize ball-playing goalkeepers , Japan appears to!
Conclusion
I set out to create a metric that can, with some accuracy, help identify teams (or managers, really) that use their goalkeepers somewhat regularly in buildup. Conversely, we can find teams that do not use their keepers much in buildup. And then by extension, we can identify leagues and possibly countries where ball-playing, buildup-joining goalkeepers may be the norm and thrive.
While this is fun to see as a fan, I think there are also some applications for recruitment… both player and manager identification. If a team needs a goalkeeper comfortable in possession, they could use this metric to identify players who have likely already proven themselves to be confident on the ball.
On the flip side, if a club is looking for a manager who likes to use their keepers in buildup (which let’s be honest, probably means they’re a manager who prizes tactics and technical possession), they can use this to see what teams do so and investigate their managers.
