
Article by Ben Griffis
What players tend to pose the most immediate danger to the opponent’s defenders and goalkeeper with their passes? This is the question I’m looking to (begin to) address with a new metric I rather non-creatively term, Passing Danger Index, or PDI for short.
The idea behind this is to see which players tend to complete plenty of passes that typically create dangerous opportunities for their teammates. I use four metrics to create the PDI. Completed smart passes, deep completions, key passes, and shot assists.
Before we go further, here are the definitions of these variables from Wyscout, the data provider I’m using here:
- Smart pass: A creative and penetrative pass that attempts to break the opposition’s defensive lines to gain a significant advantage in attack.
- Deep completion: A cross or pass that is targeted to the zone within 20 meters of the opponent’s goal.
- Shot assist: The last action of a player prior to a teammate having a Shot.
- Key pass: A pass that immediately creates a clear goal scoring opportunity for a teammate.
The Method – Harmonic Mean
The general calculation to create the PDI is straight forward. The PDI is the harmonic mean of these 4 variables. One major benefit of a harmonic mean vs a standard mean (arithmetic mean) is that it prizes both the level of the variables and the relative balance between them.
For illustration on the differences of these two means, and the benefits for this metric, let’s look at the examples in the table below.

In Scenario A, the four variables are all relatively balanced. The harmonic mean is just a little lower than the arithmetic mean. This is mainly because there is some level of unbalance in shot assists vs key passes.
Scenario B changes one of the variables (shot assists) to essentially 0. Mathematically, if any variable is 0 you will get an error in the harmonic mean without first adjusting to make that value non-zero. We can see that the harmonic mean is now 0.00, but the arithmetic mean is 0.88… not zero!
Then Scenario C is a case where one variable is incredibly high. The harmonic mean is then much lower than the arithmetic mean.
In these scenarios we can see that the harmonic mean is not as affected by a randomly large value as is the arithmetic mean. Conversely, the harmonic mean responds more to a randomly low value than the arithmetic mean. Please read the Wikipedia article linked above for more detailed information, but mathematically, the harmonic mean will always be lower than the arithmetic mean in all cases where the values are not all equal.
For the purpose of the PDI, I choose the harmonic mean so that we have a better view of players who pose somewhat similar threats for all types of the passes included. I want a player who completes no passes within 20 meters of the goal to be given a very low score. I also want a player who records a single value much higher than their other values to have that metric almost weighted less than the arithmetic mean would. I want to reward players with not only high numbers in all four of these metrics, but also penalize those who have one or more drastically low scores too.
You may disagree. And that’s ok! If so, I encourage you to use the arithmetic mean or even the geometric mean (essentially between harmonic & arithmetic) to create your own scores. However, I think the harmonic mean gives us some very strong information we might lose using an arithmetic mean.
Harmonic means are used in many places, and in fact there is already a harmonic mean in use in Baseball! The “power-speed number” is the harmonic mean of home runs and stolen bases. While not used widely, it attempts to quantify players who can both smash home runs and also steal an extra base. A simple arithmetic mean would over-value players who can only steal, or who can only hit home runs.
Overall, harmonic means help address scenarios with differently-sized values. It can often be closer to the “true” average in cases like Scenario C above, and are used widely in physics, finance, and more disciplines to address these scenarios. And especially, since passes like deep completions are typically more common than smart passes, the harmonic mean can help address this. Here is a very detailed dive into the three types of averages if you are still curious or want to learn more.
Metric Selection and PDI Interpretation/Use
The reasoning behind these four metrics (technically five, per Wyscout as deep completions are separated into crosses and non-crosses but I add them up) is, as I mention above, that they all pose immediate danger to either the opposing defenders or goalkeeper. Shot assists, of course, deliver shots. Key passes lead to goal-scoring chances. Deep completions put the ball very close to the net. Smart passes create a much more advantageous attacking situation.
Combining what we just learned about harmonic means to these variables, we can see that players ranking near the top of the PDI will create, via their passes, some of the most dangerous potential situations for the opposition to deal with. And, these players would also be able to create these dangerous situations via several methods! Directly assisting shots, creating a goal-scoring chance (key pass), passing the ball essentially into the box (deep completion), or working to unlock a defense (smart pass)… those players can and do do it all.
In terms of interpreting a PDI of, say, 1.25, it does lose a little bit of tangibility. Since I’m looking to almost punish a player’s score that records extremely few of one type of pass, and to diminish any extraordinarily high numbers, a PDI of 1.25 is more an indication of we could expect 1.25 passes from any type of these passes per 90 minutes, rather than 1.25 exactly per 90. If that makes sense.
The PDI will be best suited as a complementary metric rather than a single metric to be used for grading a passer. Especially when looking exclusively at midfielders, for example, instead of all players in a league, the players near the top will cause constant and prolific danger with their passes. Probably best suited for recruitment purposes, the PDI could be but one indicator to find potential prospects to dive further into. Again, players with high PDI scores for their league and/or positions will be the players who create lots of dangerous opportunities from many types of passes.
To Possession-Adjust or not to Possession-Adjust?
A classic question we always need to ask ourselves when analyzing football data… should we adjust based on the players’ team’s average possession? For many variables, especially for passing, players in teams with tons of possession will have more opportunities to, well, make more passes. Including the passes used in the PDI’s calculation. Of course, team tactics play a role as well but that is much too far beyond my wheelhouse now.
I think that the “best” way to use PDI would be to adjust the input metrics for team possession first. I’ll present example of non-adjusted and adjusted below. Especially from a recruitment standpoint, we’re going to want to try controlling for possession. That will allow us to see which players from teams with some of the least possession might be dangerous when their team does get possession. Similarly, we don’t want players to look more dangerous just because they play in a team with tons of the ball.
From a pure visualization or simple league ranking side of things, we don’t need to adjust. If we just want to see which players typically create the most dangerous opportunities from their passes during an average game that season, we shouldn’t possession-adjust. For example, non-adjusted data has the high or low possession numbers inherent in it. So if Kevin De Bruyne ranked as #1 in the Premier League’s non-adjusted PDI, we would expect to see him creating the most dangerous opportunities in any given game. If we used an adjusted PDI and James Ward-Prowse was on top, for instance, there’s no guarantee that he would create more chances than KdB in a Manchester City – Southampton match… however we would expect him to then create more dangerous chances per unit of possession than De Bruyne.
Overall, it comes down to what you want to see. Non-adjusted PDI is good for showing the players who have created the most dangerous situations per 90, on average, in the league so far. But possession-adjusted PDI (pAdj PDI) would be better suited to seeing which players we should expect to see create the most dangerous situations in a game where each team had the same possession, or how a certain player ranks compared to players on another team.
PDI Ranking Examples
Now that I’ve rambled on the idea, method, and possible use, let’s see some examples. I’ll give PDI data on two of my favorite countries, Japan and South Korea. Both countries’ professional leagues recently finished, so we can look back at the 2022 season for the top 3 divisions in Japan and top 2 divisions in South Korea.
First, let’s look at J1. Marcos Júnior, Matheus Sávio, and Ataru Esaka recorded the largest PDIs.
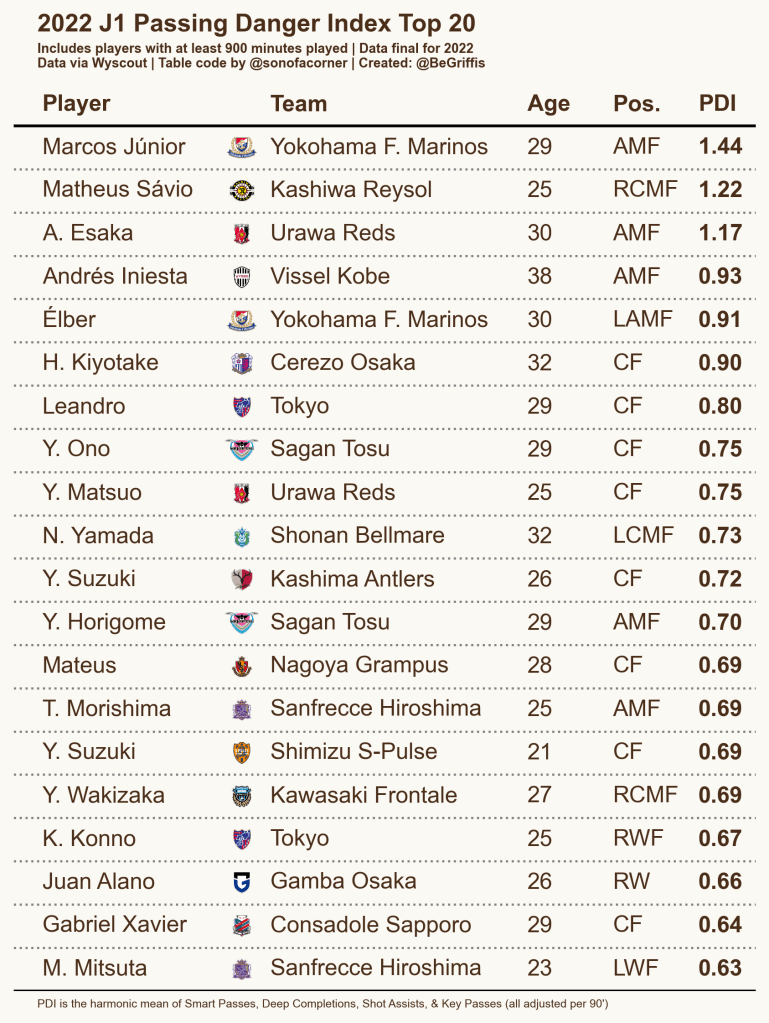
Andrés Iniesta ranks 4th, which is not a surprise given who he is, but might be surprising given how difficult this season was for Vissel Kobe. They were bottom of the league for most of the first third of the season, and only escaped the relegation battle in the final third of the season.
Immediately we see that players playing closer to the goal (CAMs, strikers, wingers, etc) tend to be the players in the top 20. Thinking about the passes comprising PDI, that should be no surprise. It’s also why diving deeper into specific positions will be important, such as in the next table.
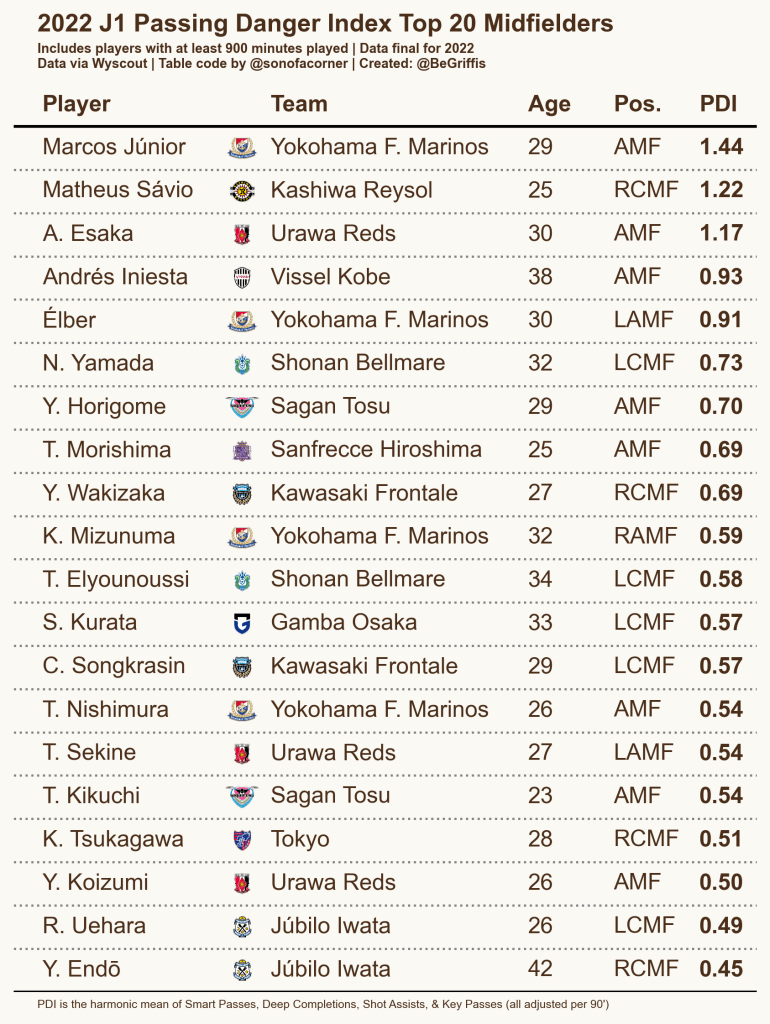
Of course, in this specific situation, the top 5 remains unchanged. But we get a better view of which midfielders can pose the most immediate threat each game with their passes. Next, let’s take a look at pAdj PDI.
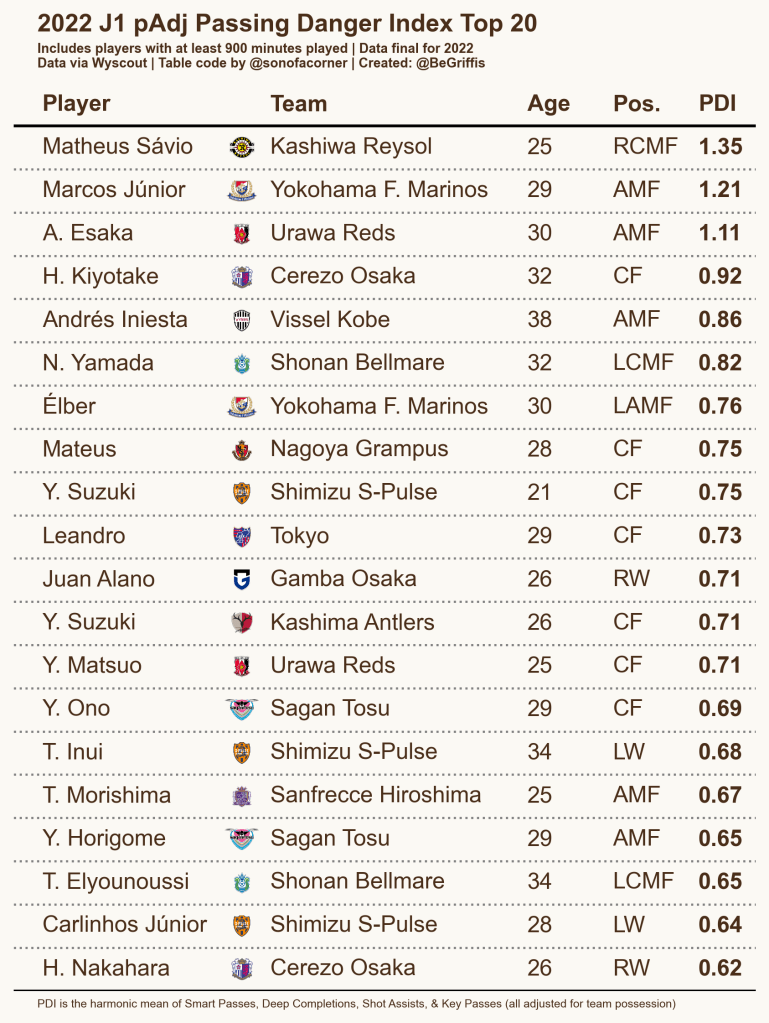
Our top 2 flip positions. And given that Sávio’s PDI increased and Júnior’s number decreased, we know that Kashiwa Reysol had below 50% possession on average while Marinos had more than 50%. In fact, Marinos had the most possession in J1, almost 60% on average per game. Reysol ranked third-to-last, with about 45%. This is a good example of the different uses and benefits of both non-adjusted PDI and adjusted PDI rankings.
Japanese & Korean Football 2022 PDI Rankings – Non-Adjusted
In this section I’ll simply give the non-adjusted rankings for J2, J3, and K League 1 and K League 2, as we’ve already seen J1.
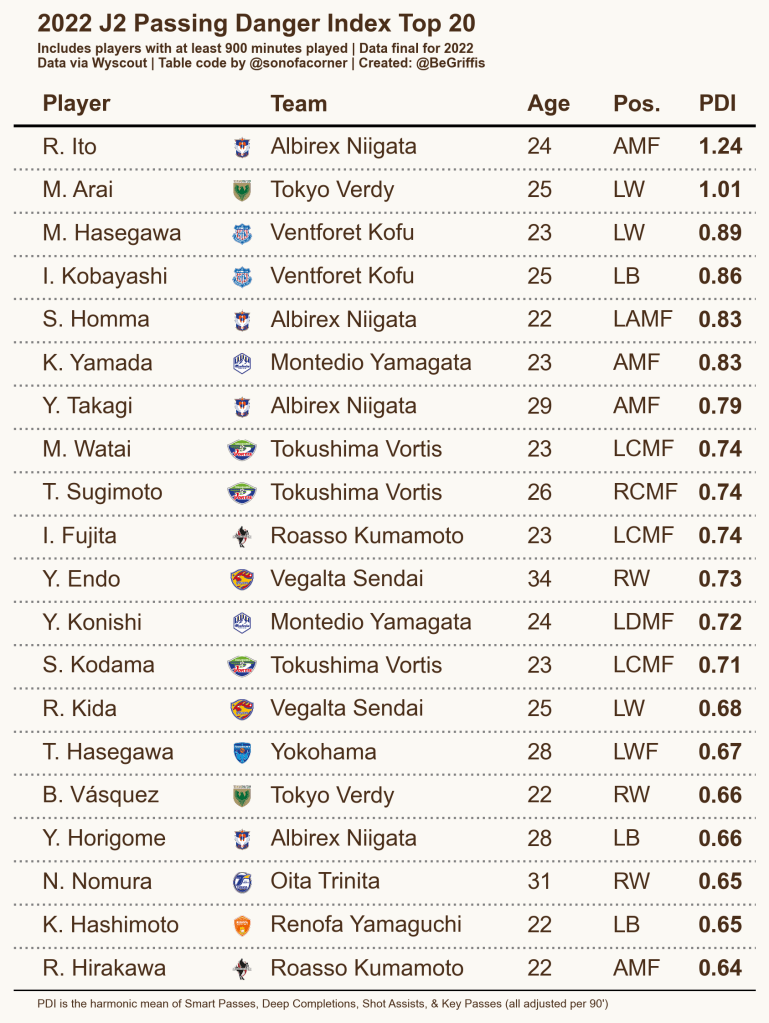
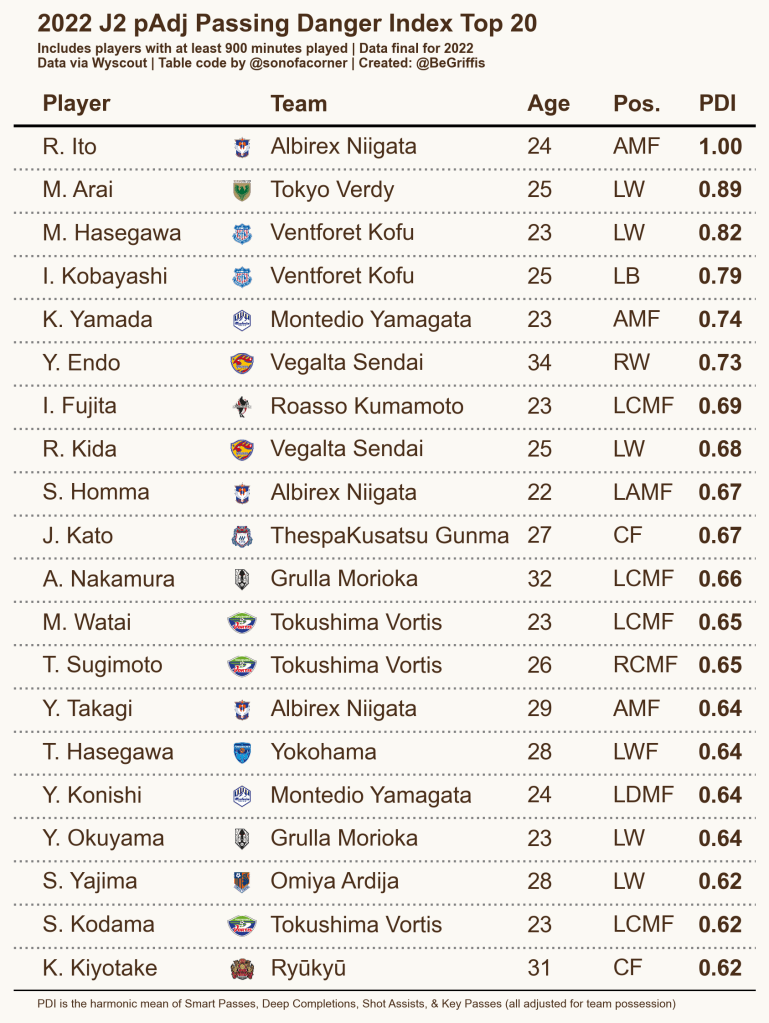
The player in second for J2, Mizuki Arai, is one of my favorites. He earned a much-deserved move to the Europe over the summer, transferring to Gil Vicente in the Portuguese Primeira Liga. He’s an explosive, energetic, dangerous winger and Tokyo Verdy used him to great effect especially when they countered. Overall, J2 has many young players in the top 20, even the top 10, showing how there might be some really exciting players for J1 clubs to look at.

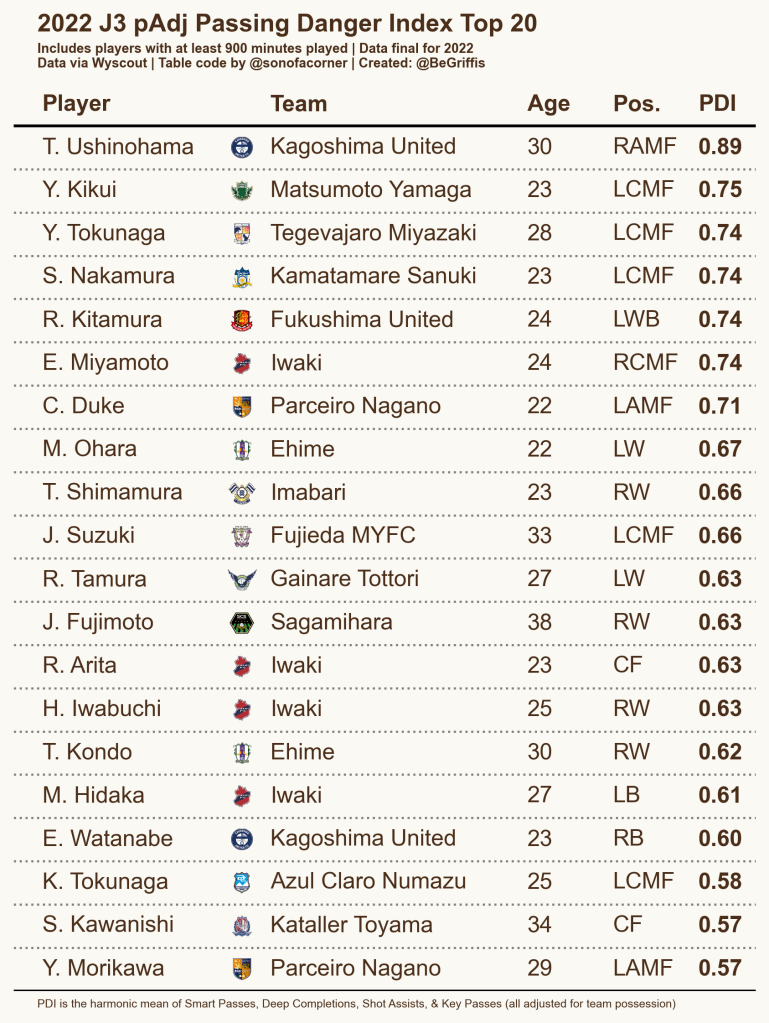
J3 winners Iwaki have no players in the top 5, however there are 4 of them in the top 20 and 3 of them are right in a row! That certainly helped them to the title, having several players ranking similarly as some of the best in the league at creating dangerous opportunities.

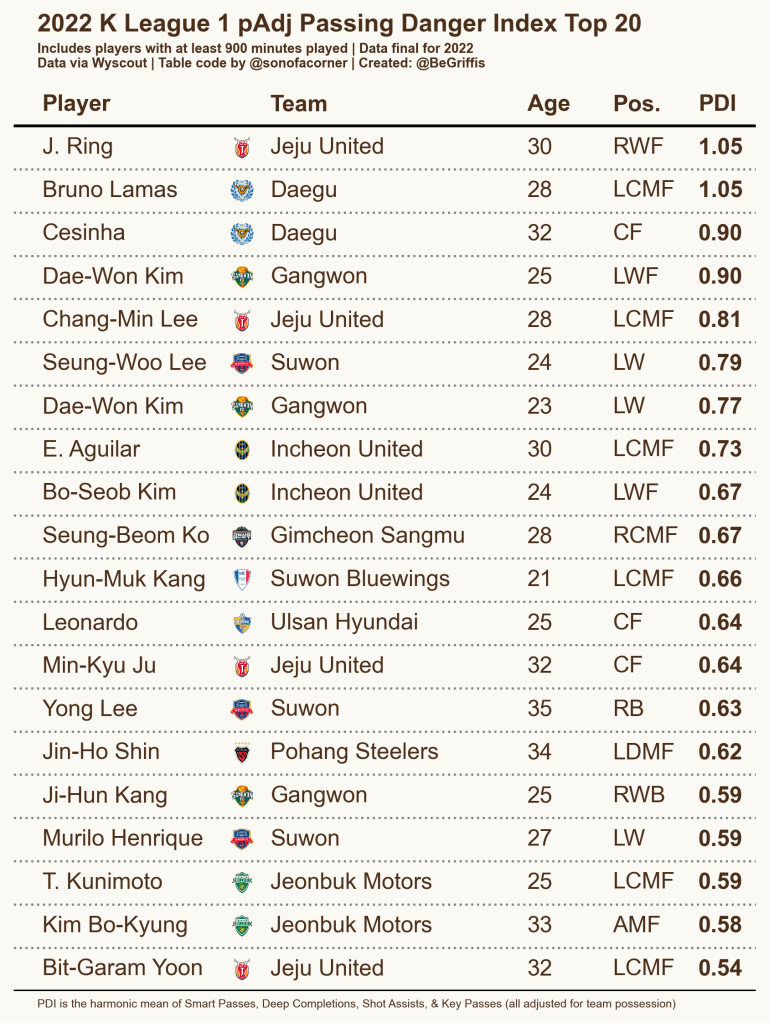
Jeju United make up the top 2, with winger Jonathan Ring and midfielder Lee Chang-min having the largest PDIs, although Lee and Bruno Lamas tie on two decimals, my program doesn’t round so Lee would have an ever-so-slightly-higher number than Lamas.
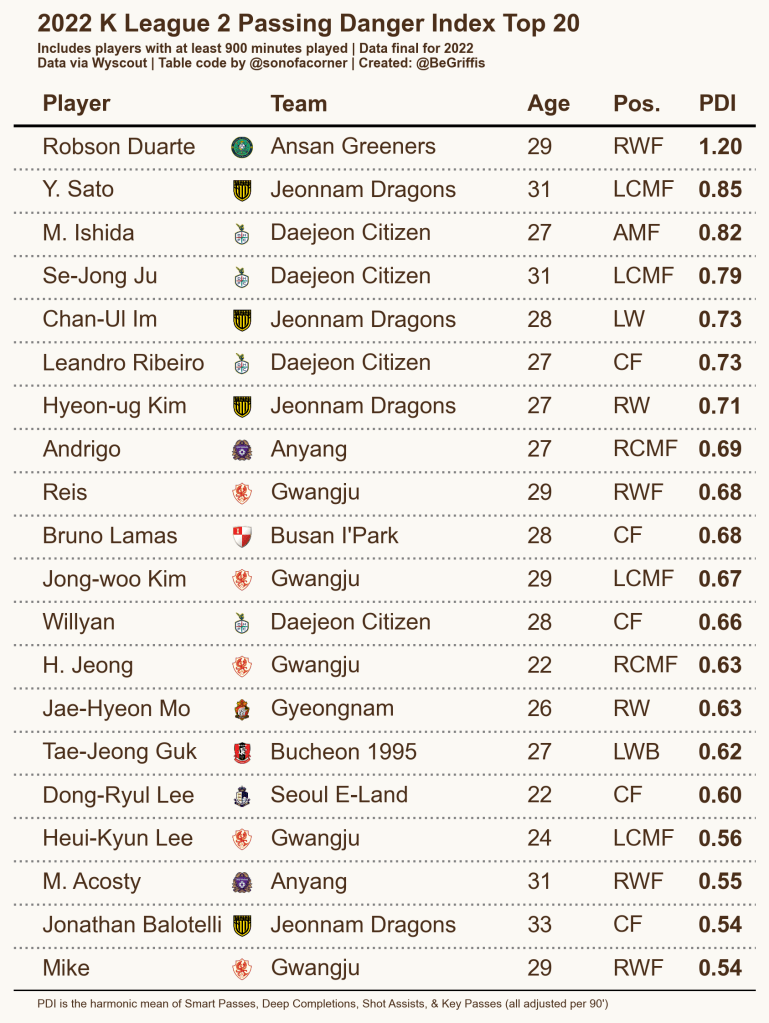
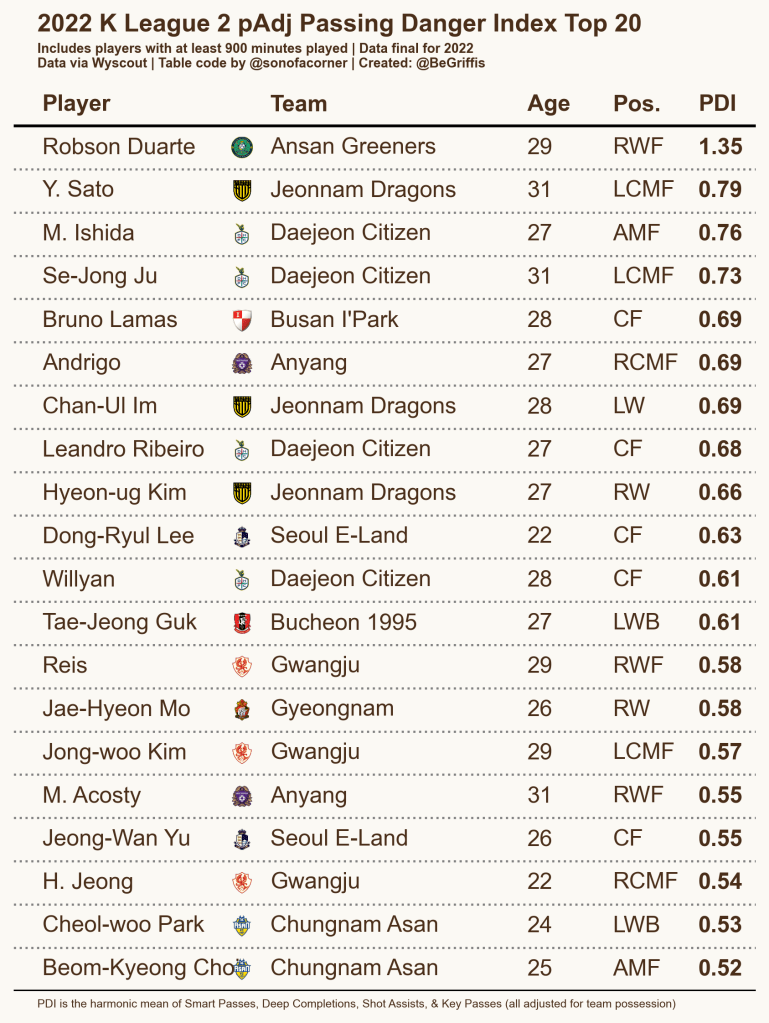
Ansan’s Robson Duarte ranks on top for K League 2, and his PDI is also quite a bit higher than Sato in second, almost 50% larger. Given that he’s also the only Ansan player in the top 20… we can see where a lot of their most dangerous passes might have come from.
Japanese & Korean Football 2022 PDI Rankings – Possession-Adjusted
Finally, let’s look at possession-adjusted PDI. We’ll see some changes, but again, pAdj PDI has better use for something like recruitment than PDI, while not being as accurate in terms of what actually happened in games during the season. I personally prefer pAdj PDI since researching players is my main interest. Again, no J1 since we already saw that above. No need to provide too much info on every league, so I’ll let you all read through the tables.
Limitations and Future Work
No work is fully perfect, so I want to discuss some limitations of PDI in this current state as well as areas for future work.
The biggest limitation/drawback for me right now is that some of a player’s passes are double-counted. For example, a smart pass that also assists a shot will be both a smart pass and a shot assist. This can create some data issues but I’m fairly confident this is not something that breaks this method in its current state. I do not have access to the Wyscout API which would allow me to exclude these things, if in fact we even want to.
That’s an avenue for further research. I would like to see the changes if we don’t duplicate some passes, but also see if we would want to keep them in. Since the PDI isn’t really looking at individual passes, it might be incorrect to exclude a smart pass if that smart pass were also a shot assist. However, since I won’t be purchasing the API anytime soon this is work for someone else.
Another limitation is that individual player or team style can affect a player’s PDI number. Adjusting on a per-pass or per-50-pass basis (as I’ve posted about on Twitter before) would give us a different sort of metric. That would almost be a Style-PDI, showing which players’ passing style might pose the most immediate threat to opponents. An intial calculation I made shows strikers are by far the players with the highest Style-PDI. Not a surprise, since overall, any pass they make will have a higher likelihood of being one of the 4 metrics used in the PDI calculation. A Style-PDI would have to be used exclusively to compare players in the same position but would be beneficial for recruitment as well.
These are just two limitations of the PDI currently. Overall, I hope you find the calculation, use, and benefits of the PDI interesting. Feel free to reach out to me on Twitter if you’re curious about anything regarding the PDI. I think there’s some possible extensions to this as well, with other metrics to create similar but different Indexes for things like shooting and possibly defending.

[…] för PDI – Passing Danger Index och har ett blogginlägg som förklarar närmare kring det här. Vän av ordning lär märka att han inte har med Pass to penalty area som värde, utan den lade […]
LikeLike