
Bill James, the founding father of Sabermatrics, developed a way to calculate a team’s expected win percentage. This is called “Pythagorean Winning Percentage”, and is used by the MLB itself and FBRef’s sister site, baseball-reference. The math comes from the Pythagorean theorem, hence the name.
Pythagorean Expectation
The logic is that you can calculate the percentage of games a team should have won (and thus, the W-L record in a sport with no draws) based on the runs scored and runs allowed. The original calculation that James used is below.

Of course, this is a pretty simple calculation since it faithfully uses the squared terms from the Pythagorean theorem. But baseball-reference found that using 1.83 instead of 2 for the exponent led to a better model. Other people have come up with other methods as well, changing the model and sometimes terms (such as using expected runs scored and allowed instead of actual, but that’s not as widely used). But the base idea remains the same: trying to calculate how many games a team should have won.
Basketball analysts have also modified James’ base model, using an exponent of 16.5 and using points scored and points allowed.
So naturally, my question was: can we bring this into football? Since football is unique amongst the other sports this model is used by having wins, losses, and draws, just determining the win % for a team won’t tell us the full picture.
Customizing Pythagorean Expectation for Football
What I settled on was trying to use some form of this calculation to calculate the expected percentage of available points a team should have won, based on their goals for and against. Thus, it would be an expected points model like so many publications have.
I want to caveat this all by saying I’m not sure if using Pythagorean Expectation for expected points (xPts) is brand new, since many xPts providers don’t share their exact method. But I like sharing my methods, so I’ll share everything from thought process to exponent optimization to final examples.
But I digress. Let’s get back to it. We need to customize this calculation for football, and we’ll look to calculate the expected % of total points earned instead of win %. For example, in a 38 game season (in modern times with 3 points for a win), the maximum points available are 38 * 3 = 114. AC Milan won the 21/22 Scudetto with 86 points, which is 86 / 114 = 75.44% of the total available points. This is the logic we’ll use.
Changing the variables we use, here is the base calculation for xPts%, or the percentage of available points a team should have won based on their goals scored and conceded.

However, I will introduce two methods of calculating xPts% in this article. Because football is such a low-scoring game and goals can often be random, I’ll create the same model but use expected goals for (xG) and against (xGA). Don’t worry, I’ll share all the same data for both models and offer my thoughts at the end. But, given that runs scored/allowed and points scored/allowed usually provide enough info about a baseball or basketball team’s true performance, respectively, and many times goals for/against doesn’t in football, it’s worth having a look at the xG xPts%. That’s why xG was invented in the first place, to get a much better feel for a team’s true performances since goals can often be much more random in football than baseball or basketball.

Football’s Exponent
Now that we know our variables, the next step is to determine the optimal exponent coefficient, labelled as “c” in the equations above, for football. And, note that these will be different for the actual goals method and expected goals method.
To do this, I first gathered the last 5 tables of the Top 5 UEFA leagues from FBRef. This season (as of 4/14/23) and the prior 4 completed. I’m very confident in the final numbers, but in the future hope to spend a lot of time gathering data from many more league-seasons around the world. Then I entered these calculations above, using c = 2 at first, to see the initial outcomes.
Here is a screenshot of the worksheet. The raw data from FBRef is on the left in grey, and the far right has the coefficients (currently both 2). The middle has the meat of everything. The left-middle green/yellow columns are the xPts% calculations, then we have the calculated xPts = ((3 * matches played) * xPts%), and then on the middle-right we have the squared errors, SE.
SE = xPts% – ActualPts%

The reason I have the SEs for each team-season is so that I can calculate the mean squared error, or MSE. The MSE is a great way to optimize this calculation, as a lower MSE means an exponential coefficient that minimizes the overall error between expected points and actual points.
So, now that it’s built, we just need to run Excel’s Solver tool to minimize the MSE for both coefficients.

Once we do that, we get these values:
Optimal c for Goals method = 1.275
Optimal c for xG method = 1.536


These are the c values that will likely give us the best possible xPts using each method. Below is a visual comparing both methods. Overall, both are strong predictors of actual points %, and we naturally see the goals method having a higher correlation than the xG method. This is expected, since final scorelines are what determine points, not xG scorelines.

Initial Examples & Comparisons – 22/23
Now that we have our optimal coefficients, we can put these into practice for the current season. Not only to see over-/under-performers, but also to see how well each method works on this specific season.


For this current season, the goals method has a Pearson correlation = 0.959, and the xG method’s value is 0.867. Again, both are very strong (which is expected), and the goals method is a stronger correlation. The choice of which to use really comes down to the difference between what xG measures vs what goals measure.
Top 15 Under-Performers in the Goals Method
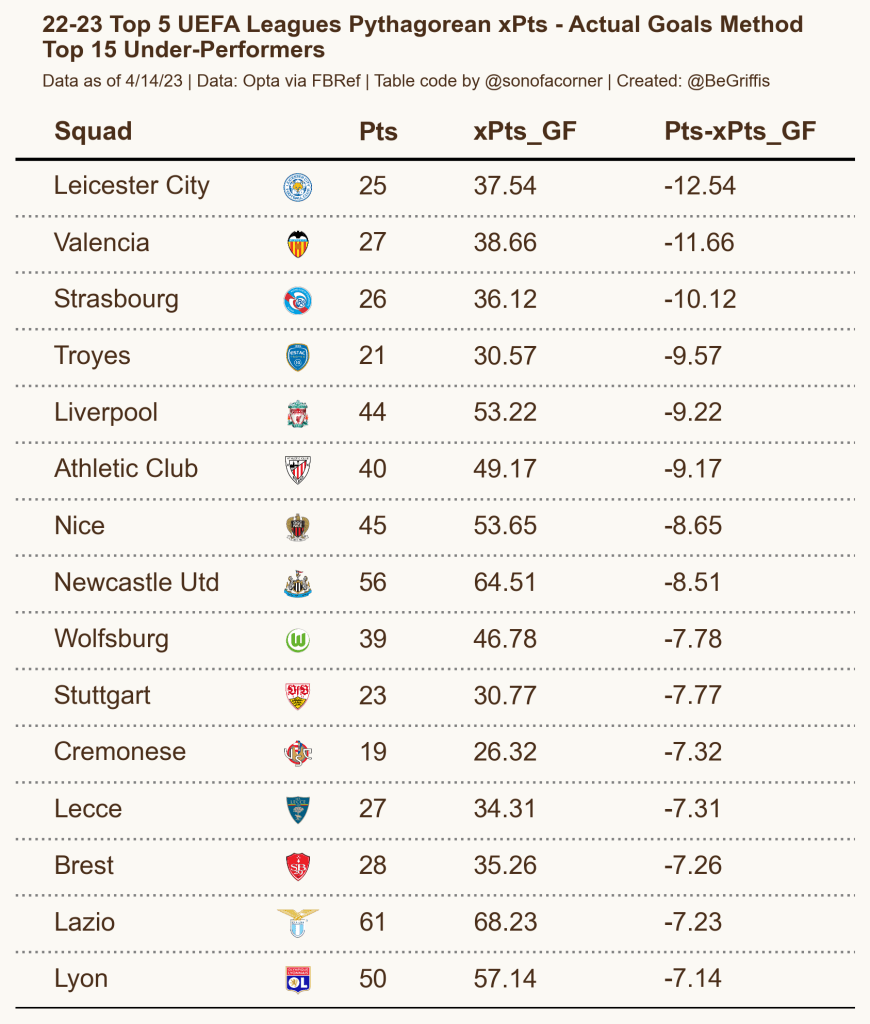
As of time of writing, Leicester are currently the biggest under-performers when using the goals method of calculating Pythagorean xPts. They have won about 12.5 fewer points than expected, based on the number of goals they have scored and allowed. Valencia and Strasbourg are the other teams who have under-performed by at least 10 points this season.
We can interpret this as: given the number of goals Leicester has both scored and conceded, they should have between 35 and 36 points. But they actually have 25 points, meaning that they probably have a lot more goals or a lot fewer goals conceded than what their points tally would expect. And that’s actually true, since they’ve scored 40 goals despite being in 19th. They rank 10th in the Premier League for goals scored, the only bottom-half side in the top half of goals scored! They’re very inconsistent, scoring 4 goals in 4 games this season, while also failing to score in 10. Of the 8 games they have scored 2 goals, they’ve lost 3 and drew 2 of them. So when we dig into their numbers, it’s no surprise why the xPts has them much better than they are. For their points, they have roughly normal concessions but abnormally high goals.
Top 15 Over-Performers in the Goals Method

Manchester United rank as the biggest over-performers so far, a fair bit ahead of the large group including Real Valladolid, Arsenal, Freiburg, and Bournemouth who round out the top 5. United have recorded a 1-0 win 5 times this season, so I think that’s why they’re so much higher than the other teams. If you think about it, scoring just 5 goals over 5 games would likely not lead to 5 wins, regardless of the goals conceded. It tells me the model sees United as essentially having “vulnerable” results, where even a single goal in a game could slash their points That’s at least my initial thoughts on their number, don’t take it as the gospel as to why they’re given a big over-performance number.
Top 15 Under-Performers in the xG Method
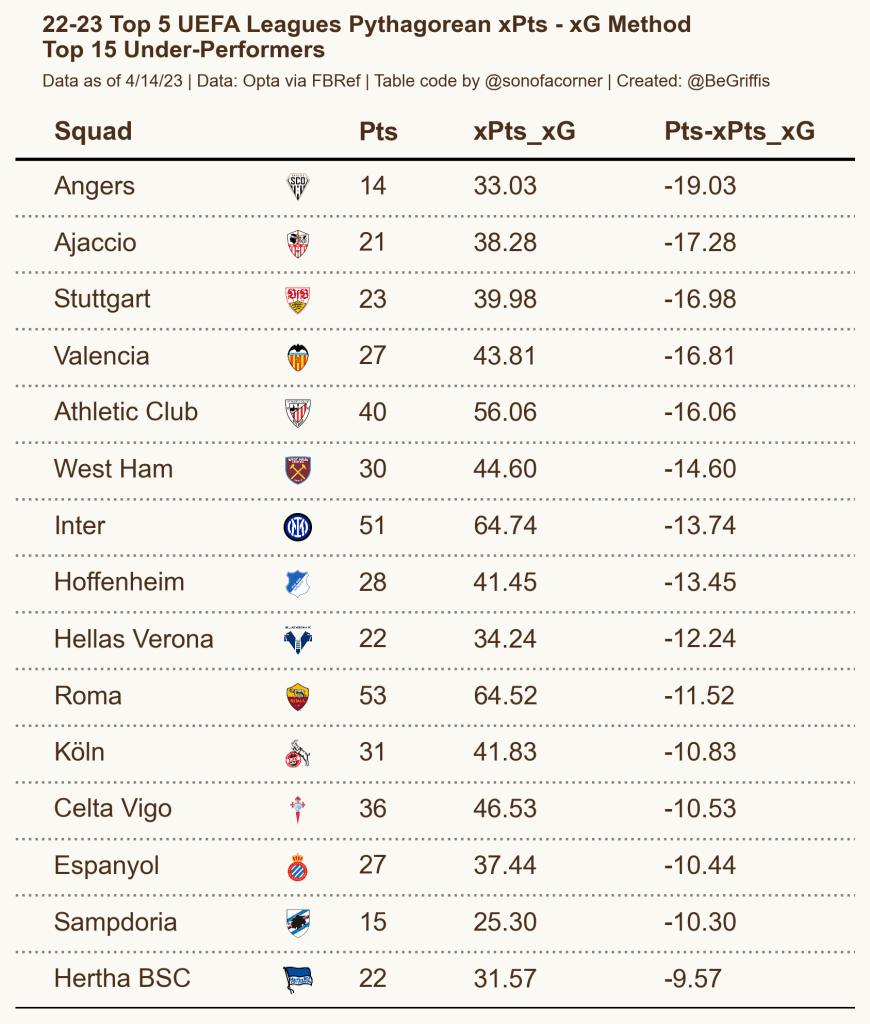
Now we shift to the xG method of xPts. Remember that this has a lower correlation with Actual Points than the Goals method. Regardless, Angers are the biggest under-performers in the Top 5 UEFA leagues so far given their xG and xGA. Expected to earn 33 points, they’ve only earned 14, less than half of their expected total. Ajaccio are right behind them, which makes sense since both clubs have almost the exact same xG (33.7/33.8 respectively), but Angers have about 7 more xGA (48.2/41.0 respectively).
The best teams in this list are Inter and Roma, both under-performing by over 10 points. Inter have the most xG in Serie A and 2nd-lowest xGA, while Roma have the 5th-most xG but the lowest xGA. That’s why Inter are under-performing by more than Roma as well, having very similar xGA but more xG and also fewer actual points. In the case of Roma, their very low xG tells us they should have more points. As a Romanista, I can tell you that passes my eye test!
Top 15 Over-Performers in the xG Method
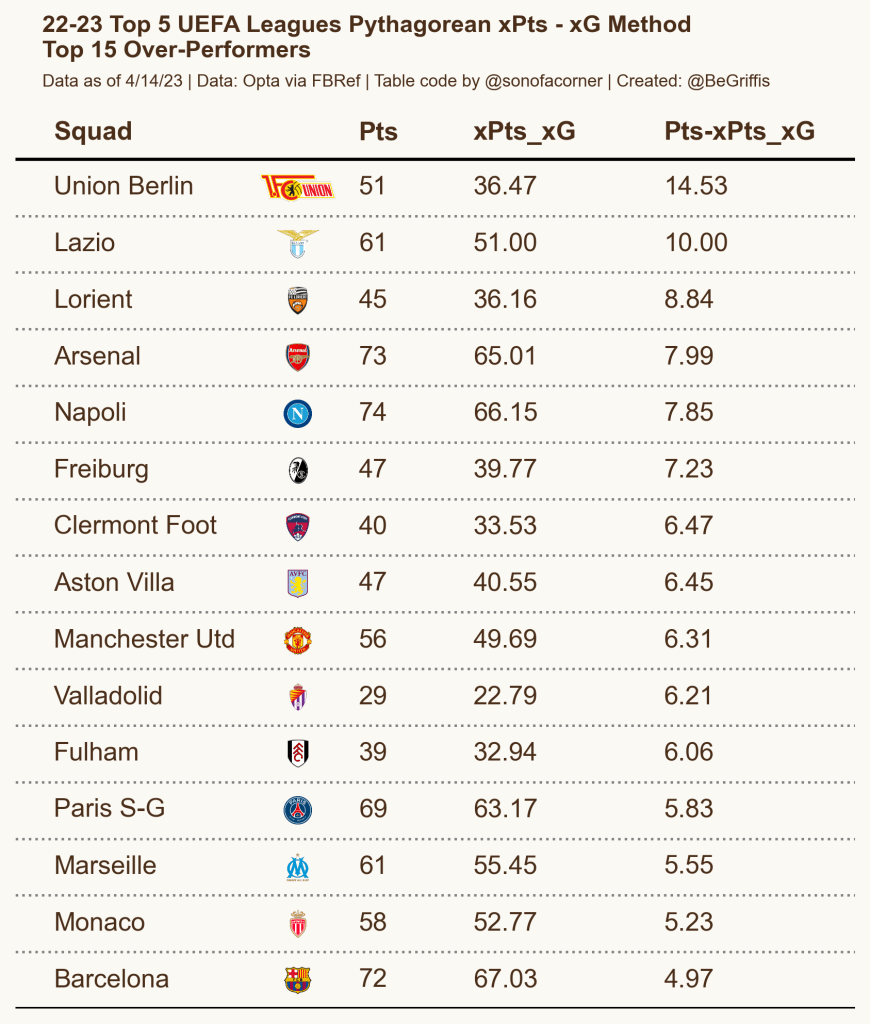
Finally we get to the biggest over-performers based on xG and xGA. Union Berlin take the cake, which makes sense given they have basically the joint-lowest xG in the Bundesliga this season and also the 3rd-lowest xGA. They’ve scored about 13 more goals than their xG, which naturally will give them wins or draws that they shouldn’t be “expected” to get.
The Premier League and Serie A title leaders, Arsenal and Napoli, are both in the top 5 here, but Napoli are 13 points clear of 2nd-place Lazio at time of writing, who are over-performing even more than Napoli. Manchester United, the biggest over-performers based on the Goals method, over-perform by the xG method at almost the same rate. 6 points via xG method, almost 8 by the Goals method.
Thoughts: Goals Method vs xG Method
In my eyes, both of these methods can be used simultaneously, as they offer different insights and even potentially interpretations.
The Goals method looks at the actual goals, of course. We can look at this as an expected points tally based on what has actually gone in the net. This includes own goals. It can give us a bit more info on the consistency (or lack thereof, like Leicester) of a team’s results and goals, or on how vulnerable their results might be, such as in the case off Manchester United. Wins by a single goal are of course more vulnerable than 2-goal victories. A single goal swung either way (-1 scored or +1 conceded) drops a team by 2 points.
I almost see the xPts via Goals method as an indicator of results.
Conversely, the xPts via xG method is likely a better indicator of performance.
Since xG and xGA aim to explain a team’s performance in attack and defense over time (single games excluded from this rationale), using xG and xGA in the Pythagorean expectation model allows us to interpret the xPts as the number of points a team should have based on their relative performances in front of both goals.
The correlation of the Goals method should always be higher than xG, as you can’t win a game with xG but you win games with goals. xG aims to measure performance in such a low-scoring sport like football.
Which Method Do I Prefer?
Luckily, we do not need to choose just one xPts method! Both can be used, and both strongly correlate with actual points. I’ve made sure to publish the exponential coefficients for both methods for a reason. But IF I had to choose one method to answer the question: “how many points should team X have been expected to earn?”, I would use the xG model.
Why? Well, for the sole fact that expected points, to me personally, should try to show how many points a team’s performances would indicate they should have. xG and xGA get to that point better than actual goals for and against.
However, with that said, the Goals model is still a very good and useful method for determining xPts. And it’s able to used more broadly since xG data isn’t available for many global leagues, and beyond that, high quality xG data (from the likes of primarily StatsBomb and also Opta) aren’t available for most. The Goals Method for xPts can be used for any league in the world, you just need to have the very basic table.
Wrapping Up
I have not yet read an article that introduces the Pythagorean Expectation into football. I’m not saying I’m the first, as I hate saying that, so please reach out to me if you know another article that develops this method for football, I’m curious to see their method and/or coefficient!
With that said, the xPts% and xPts can be a valuable tool for seeing if a team’s current points are about what they should have, or if they’re likely over- or under-performing. Like with goals vs xG, a team over-performing over a short period of time will probably have some correction later on. Below I have a very rough sketch of this, looking at Anderlecht’s 10-match moving average Actual xPts% vs xPts% via Goal Method. It looks at each 10-game span, dividing the actual points won by 30, and then subtracting from that number the xPts% based on the goals for & against in that same 10-game span.
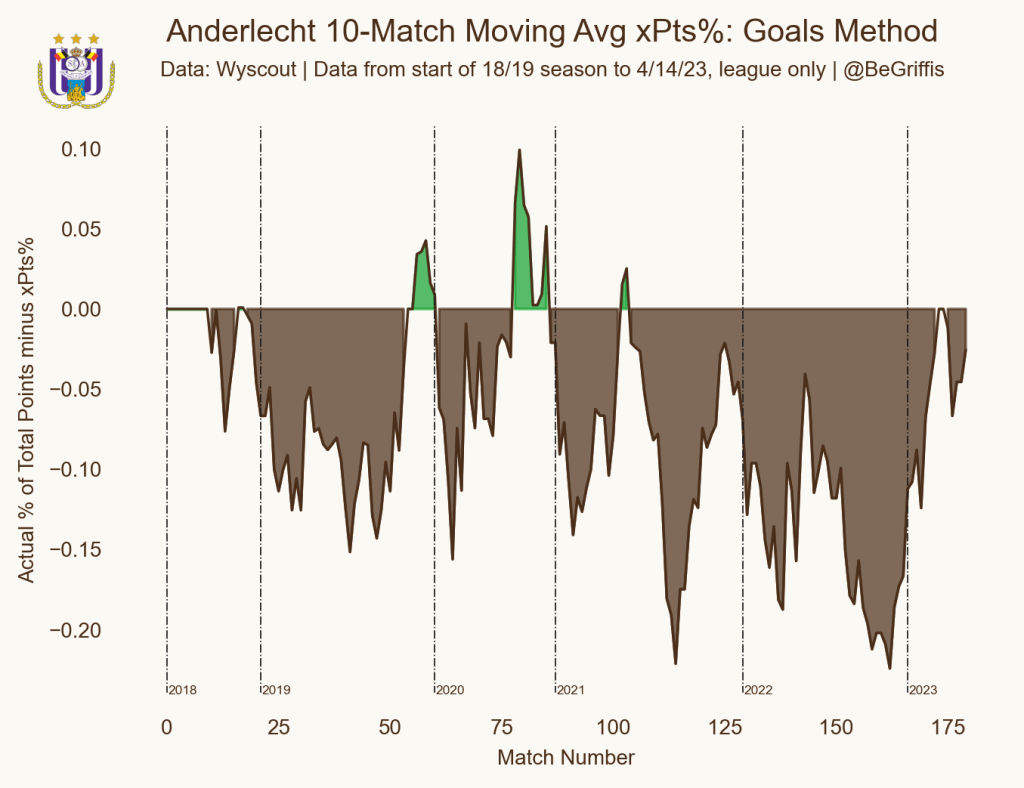
We see that Anderlecht have under-performed for the vast majority of the time since the start of 2018/19, with a lot of fluctuation. This does seem to back up that over a short period of time, clubs can and will correct themselves, but it also shows us that a club could consistently over- or under-perform over a longer span. This is where a drastic change may be needed, which if anyone’s followed Anderlecht in this time frame you’ll see that this is probably a graph that passes the eye-test.
I think there’s lots of potential for the Pythagorean xPts% in football, and more development and tuning should be looked into. I know I will be gathering a very large dataset to see what if there’s a more optimal exponent coefficient, however I invite you all to begin using these numbers I’ve shared. And as always with articles I write like these, any and all feedback and further development of this is welcome and only beneficial to public football analysis.
Here is the code for this article, with everything you need to scrape FBRef’s Big 5 UEFA leagues and then calculate the xPts% using both methods.

I like this. You could turn this into a fun game to see which overperforming clubs using either method would invest in new players with team value (not hype) and in what positions. Some clubs are probably more obvious than others; i.e. Man U need a real No.9 and Arsenal need depth. But a team like Aston Villa or Union Berlin.
LikeLike