
Factions have formed in modern football circles. One faction is the “football is played on grass” trope. Another faction includes the people saying how you can do anything and everything with football data.
Opinions are personal. We are welcome to hold any opinion we want, that’s the nature of life. And people can agree or disagree with our opinions, and bring evidence for or against any opinions. But the reality is that the data-vs-eyes debate in football is not a dichotomy but a spectrum. Of course, people can agree or disagree that data is useful, a good tool, necessary, or anything else, but there are benefits and limitations of both data and the “eye test”/video.
In many fields of social science academia, you have similar groups of people. One group prefers testing data from more subjective methods like surveys, interviews, and the like. Another group prefers using more analytic methods like mathematical modeling and simulation to test their hypotheses. However, neither group is “right” or “wrong” in their findings, and both groups will lose critical information by only working and citing within their silo. And of course, many researchers will work with and in both groups during their research career. Even within a single paper you can use multiple methods.
Football is similar. Beyond the copious similarities between social science research (and all research, really) and football analysis (both public, like myself on Twitter, and private, like major companies and clubs), one of the major takeaways is that there is not an “either-or” between data and video. It is a spectrum. Without any videos, you miss out on precious information. Without any data, you miss out on precious information. The question is not “should I use data or should I go watch a few matches?”, but rather should be, “how much data, if any, should I use for this particular case and how much video, if any, should I watch as well?”
The Spectrum
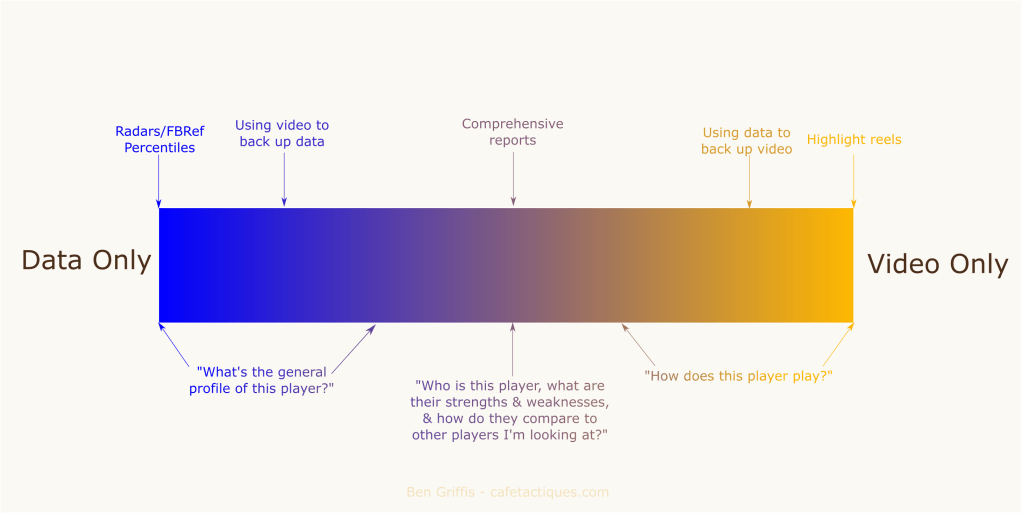
The spectrum of data vs video might be (very) roughly conceptualized like this above. Using just data would be good for seeing a quick profile of a player’s numbers and how they compare to others in their position and league. But without video, you are only getting a basic profile and lose out on much needed context. For example, do they have a low pass completion rate because they are bad at passing, or because they play a role in their team that requires them to play more passes which are typically high-risk-high-reward but low completion rates? Going further, how does that player’s pass success rate compare to other players in a similar team and role?
On the other side, using just video is great for seeing a player’s passes. With video, we can see that context we were asking for in the data. You can see the system that player plays in and their role in their team. You can see technique as well, such as how they actually play passes or receive a ball, maybe their first touch is great or poor. However, without data, we can’t compare that to the rest of league. Well, not easily! That’s why the advent of data (and big data recently) has skyrocketed the world’s general level of growth and development, and it’s no different for football. We can do a lot without data, but the decisions we come to, and the speed at which we come to them, are worse than with data.
Data and video are complementary, not opposing forces. Together, they work together to increase our understanding of the game and, particularly important for people inside the game, decision-making. There’s a reason why UPS instruct drivers to try avoiding left turns when possible, and it wasn’t the CEO waiting at a couple long left turn lights on his way to work one morning.
Where on the Spectrum Should I Be?
The key to answering this question is knowing that there isn’t a single answer. You need to look at what you’re trying to do and then see whether it’s better to be on one side or the other, or maybe the middle and use a lot of both data and video.
Further, for different levels of analysis you can find yourself on opposite sides of the spectrum. If you’re writing your “summer recruitment plan” for your favorite team’s blog, you should find yourself on one side at various points in your project. Initially, you want to cast a wide net to find possible targets. That would be over on the data-only side. As you start paring the list down, you’ll of course need to watch those players. You need to see how they play, what their role is, any glaring weaknesses such as a low work rate that data can’t capture, and more. This will be further toward the video-only side.
By the time you’re done with your project, you likely will have “averaged” in the middle, using lots of data and video. Because for each player, you’ll have had to look deep into their data, and look deep into their videos.
Of course, projects like these are massive. The same flow can be used for looking into a single player just for fun. For example, I found an interesting player a while back by looking at data. I dove into Bakhtiyar Zaynutdinov’s data, and even made a big thread using exclusively data (team data, not a radar) focusing on him.
My knowledge of Zaynutdinov is much deeper than my knowledge of, say, any of the 30-something players I profiled in my recent article about interesting Serie C players. I know a lot about each one of those players’ data, but I have hardly watched any of them play with my eyes. And I said as much in that article as well as a similar one for LaLiga SmartBank.
I also know more about Zaynutdinov than I know about Warinthon Jamnongwat, who I have pretty much only watched videos of. I haven’t done any real dive into Jamnongwat’s data outside of a radar at the end of this thread, so there’s a lot of aspects about his play I don’t know yet. Particularly how he really compares to the other fullbacks in Thai League 2. On the spectrum chart above, I’m in the “using data to back up video” area, so I have limitations to my knowledge.
I don’t share my own work to praise myself or provide a guidebook, but merely as examples I can use to illustrate the spectrum.
Overall, you simply cannot avoid the existence or use of either data or video. There are many times where using one or the other are beneficial. There are also many times when using just one or the other is not beneficial. That’s the story when we have two complementary tools at our disposal. Knowing where to place yourself on the spectrum to answer a given question is not always easy, either. Placing yourself too far to one side will lead to a worse analysis, conclusion, or decision. It’s not the end of the world, of course, but if you really want to answer (or begin to answer) a specific question, you’ll need to ensure you place yourself as close to the optimal location on the spectrum as possible. And like everything in life, you’ll never be at the optimal location so you’ll have to understand the limits of what you create.
A Quick Example
Blaublitz Akita this season are a decent case study to quickly see how one’s conclusions might be bettered by combining data and video. At time of writing, after 9 matches in 2023, Blaublitz have the 2nd-lowest average possession per game in J2. 37.3% of the ball on average. We’d assume they probably sit back.
Further, Blaublitz rank a little below average for their PPDA, or passes allowed per defensive action, which is a measure of pressing intensity, with a PPDA of 9.6. They also rank a bit below average for the number of challenges per opponent minute of possession, which is similar to PPDA but controls for high- or low-tempo passing opponents, with 5.9.
Blaublitz also rank #1 for expected goals against (xGA), meaning they have faced the least xGA. they rank #2 for lowest xGA per shot faced as well. They also have conceded the 3rd-fewest goals (4) and 2nd-fewest shots (70).
Overall, the data seems like they might be a team who parks the bus. They might be very good at parking that bus, but seem to park it nonetheless. Relatively low pressure, almost no possession, few shots against… Looking at the data makes it seem like they’re José Mourinho’s team, right?
Well, watch this.
Blaublitz, as we see in the video, do not just sit back. They have a proactive defensive system which centers around hybrid man-marking, passing lane cuts, and pressure. They do these deep in the opponent’s half as well. There’s not a bus to be seen in this clip! It’s incredibly effective.
Of course, if we didn’t see the data before this clip, we would see they’re proactive at defending, but we wouldn’t know just how successful their system is. It’s only when we look into their data do we see how great their system is faring compared to all other teams so far this season.
As we can see, by being on the wrong end of the spectrum, we thought Blaublitz may be a park-the-bus team. But they’re certainly not! Calibrating where you are on the spectrum is vital to making the best analysis you can.
