
Article by Ben Griffis
A while ago I explained some of my feelings towards defensive metrics. The widely available and used metrics are almost all bad for analyzing defensive performance. Percentages like tackle success rate & aerial win rates are about the only semi-useful available metrics.
In that article, I also touched on some of my ideas of how we could start using data to not necessarily make new single-number metrics, but rather to begin analyzing defensive performances. Event data and defense aren’t exactly best friends like event data and and attack are, but there are some ways we can begin to manipulate data in order to spark a relationship.
For this article, I’ll share my first step towards trying to get a better view of defenders and defensive skills using event data. This is not comprehensive, nor is it meant to be. I’m sharing this more to illustrate the type of process I think we’ll need to use to better look at defenders in event data. In the absence of tracking data or expensive highly-advanced data, we need to turn standard event data on its head in order to look at defenders.
The Idea
I’ll be using pressures as my sample for this work. The reason for that is that my data, from StatsBomb, tags pressures so we can manipulate that fairly simply. I’ll explain what more we might need to expand this from pressures to general play late.
Essentially, I want to look at successful pressures or tight markings of receivers. This goes beyond just pressures that end in a tackle, as we might see in basic data. A successful pressure could also be one that holds the opponent up and allows teammates time and space to form back up on a counter, or join in on the press, move to cut out passing lanes, and more. A successful pressure for me also could be one that forces the opponent into a back pass, which stops ball progression, or even an incomplete pass.
As I discussed in my defensive metric article, a lot of defense involves forcing the opponent to not do something, or to do something they may not want to do. Even if you get beat on a dribble, that could potentially be a successful defensive action if you forced them onto the wing when the dribbler was looking to move into the open space centrally and get a dangerous shot off. There’s nuance of course, but that’s the idea behind this. Even if a player successfully receives a ball, if the defender is able to hold the opponent up or force a bad pass, that’s successful for this analysis.
I use a couple parameters in my analysis to filter out the events after a ball receipt. I look at the next 3 events after a ball receipt, which typically is a carry and then either a pass, shot, or something like a miscontrol, dispossession, or other event indicating a potential successful action by a defending player. I filter out any events that take place more than 2 seconds after the ball receipt. If the player can’t force some action within 2 seconds, I don’t to call that a success. I also look at passes within 2 seconds of receiving, as it will be nearly impossible with this data to see if a pressing/defending player forced the opponent to hold the ball before passing. So I only want to see passes which are more likely to be influenced by the pressing defender.
The Data
I’ll use StatsBomb’s free Indian Super League 21/22 data for this analysis. This is an invaluable resource since we have a full season of data for the league, so we don’t have sample size issues like we would have in a single match or in StatsBomb’s World Cup data. From a proof of concept standpoint like this, a full season is necessary.
The data flags all ball receipts and pressure events. Pressured ball receipts are always preceded by a pressure event of an opposing player, which is why I’m starting my defensive-data-analysis journey with this work… it’s relatively straight forward to get the data set up!
Below is a sample of the data, annotated with some of my notes in my thought development process behind this idea.
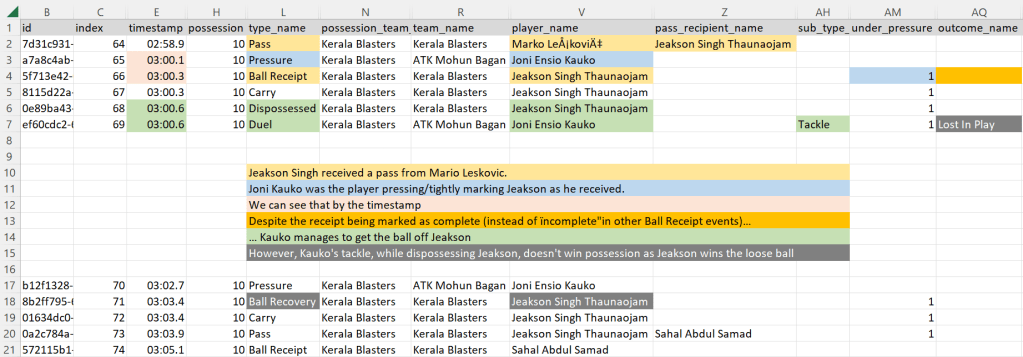
We can see the ball receipt event (cell L4) preceded by a pressure. Further, cell AM4 tells us the ball receipt was under pressure. Some ball receipts preceded by pressures are not flagged as “under pressure”, and looking at those events I believe the “under pressure” receipts are ones where a pressing player is right up on the receiver’s back. The not “under pressure” receipts that are preceded by pressures are when the pressing player is still moving towards the receiver, I believe. I could be incorrect, so please feel free to DM me any comments on Twitter.
The story of this ball receipt is that Jeakson Singh is pressed, but successfully receives the ball (shown as a blank in cell AQ4). However, 0.3 seconds after the successful ball receipt he is dispossessed. And we see the pressing player and the player that dispossesses Jeakson is Joni Kauko. In my code, this will be flagged as a successful pressure. Since Kauko dispossesses Jeakson within 2 seconds of receiving the ball, it’s a successful defensive action. Kauko makes sure Jeakson is held up.
We do see however, that Jeakson wins the loose ball back, cell L18. So while this is a successful defensive action in my book, it of course doesn’t win possession for ATK Mohon Bagan. This is an area I want to dive deeper into in the future, but for this analysis I’m ignoring if these events win possession. This is also a great time to mention that for all we know, this ball recovery and pass by Jeakson to Sahal Samad led to a goal because Kauko was out of position after pressing, holding Jeakson up, but then not winning the ball… This is why data can’t paint us the full picture of defense (yet, but I’m trying my best I promise!)
The Code & Method
Please see the code up on Asian Football Analysis Zone’s GitHub for a lot more notes and information into the method I used to code everything.
The gist is basically to code everything I’ve mentioned so far. I add information of the pressing player, the next 3 events, time change from ball receipt, and pass info like the direction of the pass (to find back passes) and if the passes were complete or not.
I then run through and calculate the number of pressures for all players, and separate their successful pressure events into “initial” successes, which is when the ball receipt itself is not successful, “2-second” successes, which is when there is some defensive/hold up event within 2 seconds of a successful ball receipt, and “pass pressures”, which is when there is not a successful initial or 2-second pressure but the next pass within 2 seconds of a pressure is backwards or incomplete.
Again, with the passes it’s a little subjective, but the idea is that passes within 2 seconds of a pressure could likely be influenced by the pressing player. The initial press successes are of course influenced by the presser, and I include a check of the player IDs for the 2-second pressures to ensure the pressing player is the player involved as well.
The Output
I hope my run-through makes sense. The gist is that I’m mainly looking for players whose pressures are successful, beyond just a tackle but instead looking at if they can break up the receiver’s play or force a back or bad pass.
The output includes the number of total pressures, and the number of initial/2-second/pass pressure successes, as well as the success rates for each of the 3 types of pressures and overall pressure success rate. It is important to break down the successful pressures so we have the ability for richer insights than a mere total success rate. This allows us to see if players may be very good at breaking up play with their pressing overall, but perhaps really strong in one aspect and weak in another.
I’ve also made sure to create two separate data frames; one which does not have the position the pressing player was in at the time (LCB, LB, LW, etc), and one which does. The data frame that does include that makes a distinction between left center back and right center back, so to analyze center backs we do need to add one more step which you can see near the end of the code file.
The reason we have to separate by position is of course the same reason we need to separate by position when analyzing players in all other areas. We can’t compare a striker’s xG to a center back’s, and we shouldn’t compare a pressing striker’s data here to a pressing center back’s.
Below is the rankings of the top 30 players sorted by total success rate. Included here are players with at least the median number of pressures for the season (28).
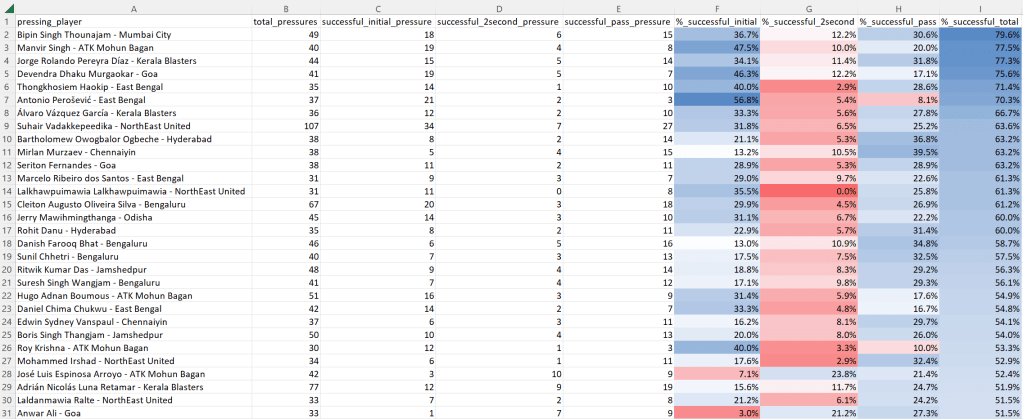
This ranking includes all players in all positions, which does mess with the data a bit. Followers of the Indian Super League will notice that a lot of the top several players are in fact attackers, not defenders (however there are some defenders). And further, when you dig deeper into the data you see defenders tend to have higher successful_pass_pressures and lower successful_initial_pressures. The reasons are likely that CBs are defending players who have more back pass options than lateral or forward, and attackers are also likely involved in a pressure attempting to make the initial ball receipt unsuccessful whereas defenders tend to attempt that less frequently and instead focus on the 2-second or passing successes naturally.
So, below is a table of the top 5 center backs with at least the median total pressures for CBs, ranked by total success rate (not shown as Jupyter Notebooks required a zoom.. but you can add the 3 individual rates).
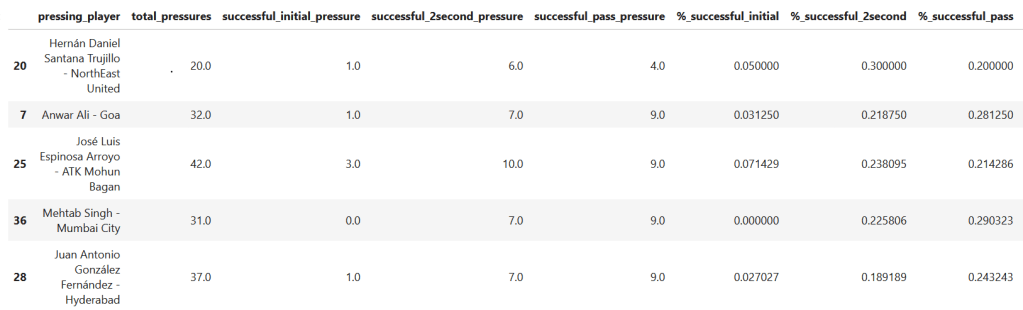
Note that this only includes pressures made when a player was in a CB position. If they’re normally a CB but played a game as a DM, those pressures made as a DM were excluded. Since where players are playing on a pitch impacts their numbers (as we saw in the overall non-position-dependent table), we need to compare pressures made when in a specific tactical position instead of the player’s typical position over a season which could be impacted by position changes.
Hernán of NorthEast United (who recently signed for FC Goa) recorded the best overall success rate, 55%. We see that he had 1 successful initial pressure, which is in line with the others nominally, but given his relatively low sample of pressures compared to the other top 5 players, it’s a decent % of his total.
Overall, these top 5 players all record similar success rates for 2-second and pass pressure successes. Like I mentioned earlier, there may be some interesting analysis if players were really strong in one of these areas and weak in another. That’s why we break this out, to see more granularity.
This next table shows fullbacks (and wing backs).
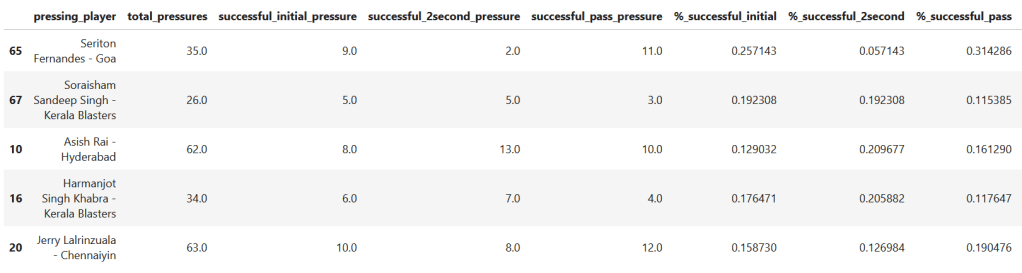
This is where we see interesting pieces of information. Seriton Fernandes of FC Goa ranks the best for FBs with at least the median number of pressures, but has a relatively poor record for 2-second successes. His initial successes and pass pressure successes are much higher. His 63% overall success rate is much higher than the 50% of the next 3 players (all tied for 2nd). 5th-place Jerry Lalrinzuala recorded a 48% overall success rate.
So, it could be interesting to dive further into Fernandes to see what is actually happening on the pitch for him in these instances, and then compare to one of the players tied for 2nd.
Finally, this table below shows central and defensive midfielders. I combine them because some tactical formations mark a player as CM or DM when there may be no real difference. Plus, on the pitch, two players marked as CMs could split and one drops to play almost as a DM and the other stays as CM… so combining offers some resolution of this.
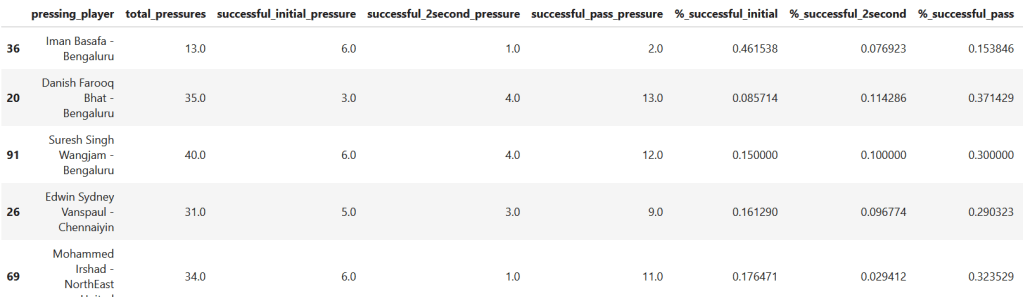
As we move up the pitch I notice an increase in overall success rates. I would like to dive more into this, but that’s for another time.. the point of this article is to share the idea, method, and results as a proof of concept.
Iman Basafa of Bengaluru recorded the best overall rate, 69%, and as we see, that’s primarily driven by his initial successes. Danish Farooq in 2nd, 57% overall success rate, sees his number primarily driven by the pass pressure successes. Again, this is why it’s great to see a breakdown of the total successes so we can get richer insights.
Wrapping Up
Overall, this is but a first proof of concept into how we can start using event data of an opponent to gain insight into the non-event actions of a defending player. As I’ve said before, event data for a defender is disconnected with many aspects of defending. In the absence of tracking data we may need to coerce event data and flip the picture around to see what the defending player is doing, instead of the attacking player.
StatsBomb’s wonderful free data allows us to take this first step and look at pressures or relatively tight marking of a ball receiver. Seeing what happens immediately after a successful reception is vital, as sometimes what looks to be an unsuccessful defensive event (i.e., a pressure that doesn’t work immediately because the received receives the ball successfully) could have some information following it that makes us rethink that unsuccessful pressure. Just like how a player being dribbled by may be a successful defensive event as I explained earlier. Or perhaps allowing a shot is a successful defensive event if it forces a one-footed player like Arjen Robben onto their very weak foot. Or perhaps you hold up a player and while you allow a pass, it’s a bad pass or one that stops an attack.
These examples don’t offer us a comprehensive view of defenders, but they would offer much better information through data on a defender’s ability/style than event data focused on the ball itself like tackles, interceptions, aerials, shot blocks, and clearances. All of these examples could also potentially be analyzed with free data, as StatsBomb 360 and shot freeze frames may give us some more information as to the locations of players and open spaces on the pitch as well as the foot a player shoots with and location of players at the time of a shot and dribble.
Again, please look over the code for this if you are curious. There are many annotations of every step, both what the line of code does as well as me saying why I’m doing that at times.
There’s no innovation in data use and analysis without discussion and tweaking of ideas, so I also encourage you to join the discussion! Hopefully the code can also allow any coders to get started looking at other aspects of event data and how we can turn it on its head to start analyzing defenders better.
