Article by Ben Griffis
This article can also be found on my Substack. I’m testing which medium (website or Substack) I prefer for hosting my future articles as I transition into full-time football work and plan on writing more articles rather than posting quick, one-off social media posts.
Football is perpetually changing. But the advent of event data allows us to quickly and simply uncover general style trends. In this article, I use Opta data to re-create one of my favorite projects, Analytics FC’s Coaching Profiles that were built by Piotr Wawrzynów.
If you only care about the results and not the long-winded discussion of the data, method, and trends, here are the main trends that we’ve seen over the past decade across 11 different (European) leagues:
- Decrease in the intensity of teams’ high press
- PPDA has steadily risen (as in, teams allow more passes per defensive action in the opponents’ first 60% of the pitch). This might be due to less “chicken with its head cut off” pressing and more structured, methodical, and/or hybrid pressing (Hi Jon Mackenzie, you sicko 👋), or possibly a quirk in the data as teams play shorter, and thus higher completion rate, passes… or both!
- Average PPDA for these leagues moved from about 9.7 in 14/15 to 11.9 in 19/20 and 13.1 in 23/24.
- Increase in the average height of defensive lines
- Proxied with event data by calculating the average distance (in % of pitch away from one’s own goal-line), the average height of actions has increased over the decade from a low of 42.0 in 15/16 to 44.1 so far in 24/25.
- Increase in the usage of goalkeepers in buildup
- One of my personal favorite tactics (paired with long thrown-ins into the box à la Puszcza Niepołmice), goalkeepers have been asked to play more passes, shorter passes, and start moving higher up the pitch during buildup. Quantifying this with the percentage of passes a GK makes that are lateral or short verticals (such as breaking the first pressing line into a DM), we see an increase in every single season, from 17.2% in 14/15 to 34.3% so far in 24/25.
- Decrease in the tendency to play long balls from deep
- Very much related to the increase in GK buildup, vertical long balls as a percentage of all passes from the first 25 meters of the pitch have decreased each year, from 18.8% in 14/15 to 12.3% so far in 24/25.
- Slight increase in ball circulation
- Effectively quantifying a team’s tendency to play lateral passes in buildup to circulate the ball more slowly rather than quickly attack, we see a general increasing trend with some ebb & flow, from 54.3 in 14/15 to 55.7 so far in 24/25. It’s only noteworthy because it is connected to the decrease in long balls, decreasing intensity/presence of high presses, and for some teams, the massive increase in GK buildup.
- “Looks like counters are back on the menu, boys!”
- The percentage of open play shots coming from counters decreased in 6 of the 7 years from 14/15 (5.7%) to 20/21 (3.8%), but appears to be storming back with increases each year since, currently sitting at 8.3% so far in 24/25.
Data
These 9 metrics (the 8 from AFC’s work plus my addition of Goalkeeper Buildup) give us a lot of insight into how teams play. I currently have a sample off over 2,800 club-seasons (i.e. Barcelona 22/23, Mainz 18/19, Sonnenhof Großaspach 15/16 etc.) from over 160 league-seasons (i.e. Bundesliga 23/24, Serie B 22/23, Ekstraklasa 18/19 etc.).
The 9 metrics are defined in my code as:
- GK Buildup
- The percentage of a GK’s passes during matches that are either lateral and less than 25 meters long, or vertical and less than 10 meters long.
- Circulation
- The percentage of a team’s passes that originate in the buildup zone which are lateral, not forward or backwards. AFC uses a dynamic zone for each team, but I found that too complex to implement and settled for a zone between 30 & 60 on the x-axis (on a pitch from 0-100) and between the box width on the y-axis. This means my Circulation metric is not as strong as AFC’s.
- Territory
- A team’s field tilt. This is the proportion of all passes in the final third that a team made. So, if there were 100 passes in the final third in a game and team A made 72 of those passes, team A’s field tilt is 72%.
- Wing Play
- The percentage of a team’s passes that escape the buildup zone (originate from buildup zone, completed outside of it) that are both forward and onto the flanks. I define “forward” here as at least 5% further up the pitch’s x-axis. So, a pass from the halfway line (x = 50) would have to end at least at x = 52.5 to be considered forward here.
- Crossing
- A team’s tendency to enter the box via crosses rather than other ways (ground passes or carries). This is a simple percentage of box entries via cross divided by total box entries.
- Counters
- A team’s reliance on counter attacks to create shots. This is a relatively simple calculation since my data does not denote phases of play except for shots. Because of this, I have to use a simple percentage of the team’s shots taken on a counter vs. a team’s total number of open play shots.
- High Press
- PPDA, or passes allowed per defensive action. This is not the best measure of quantifying a team’s “high press”, but my data does not tag pressures at all, and there’s no way to proxy pressures. Thus, I use PPDA, which is the number of passes an opponent makes in their defensive 60% of the pitch divided by the number of defensive actions a team makes in that same area. Essentially, the opponent’s half plus a little bit past halfway.
- Low Block
- I use a very simple calculation for this one. The average height of defensive actions from the team’s goal line. Since my data uses an x-axis of 0 to 100, we can interpret this as how high up the pitch a team typically defended, as a percentage of total pitch area. This will then be inverted in the calculations so that a lower number equates to a higher percentile. A team that uses a high block would have a low percentile here.
- Long Balls
- This is a percentage of a team’s passes from the first 25% of this pitch which are both longer than 25 meters and vertical.
For some leagues, I have data loaded back to 2014 or 2014/15 seasons (such as Eliteserien, La Liga, 2. Bundesliga and more). For others, data only goes back to about 2019 or 2020 (such as Premier League, 1. HNL, Serie B, Serbian Super Liga etc.). And for most leagues, I only have 23/24 loaded at the moment.
However, even with the 10 leagues that I have at least 8 seasons for, we can see a few key trends in the overall style of teams. While each team will vary season to season, we can average out trends within each league across the past decade.
Method
After calculating the raw scores, I compute percentile ranks against the entire sample, regardless of season or league. This means that the scores for each team are vs a global average, rather than comparing just within a league. Since this is style and not performance data, we don’t have to worry nearly as much about ranking against teams from other leagues, unlike when using percentiles for players.
Naturally, if there has been a general trend in a specific metric over time – say an increase in the height of defensive lines – then we would have different average percentiles across each season. So, if the presence of low blocks has waned over the past decade, then a 76th percentile score in the 15/16 Russian Premier League season might have been “average”, but a 76th percentile low block score in the 23/24 season might have been above average.
I’ll admit that using a decade-long sample could sway our view of teams’ styles in a particular season (such as comparing 24/25 Bundesliga sides, those that play a low block by today’s standards, if low blocks have decreased over time, might look they play a mid-block), but it is necessary to calculate a decade-long percentile score for these metrics so that we can see development over time.
Trends
For brevity’s sake, here is an image showing the last decade for our 10 leagues with a Fall-Spring schedule. The earliest starting seasons for these leagues are:
- 14/15: Bundesliga, 2. Bundesliga, La Liga, La Liga 2, Danish Superliga, Russian Premier League
- 15/16: 3. Liga
- 17/18: Ekstraklasa
- 19/20: Premier League, Serie B

We can see the major decrease in High Press (and Long Balls and Low Block) and major increase in GK Buildup (which went from the lowest average percentile in 14/15 to highest in 23/24), as well as the slight decrease and then big swinging increase in Counters discussed at the beginning of this article. Circulation’s slight increase over the decade is also visible, but again, I think this is only noteworthy because of how it’s connected to the other interesting metrics.
Territory is, of course, 50 each season. Crossing and Wing Play are related as well, and had a slight increase into 19/20 then came down again, although both are ever so slightly higher today that they were 10 years ago (from about 47-48 to about 51-52 now). I won’t discuss these metrics any further but wanted to call them out nonetheless.
The main metrics I’ll discuss are High Press, Low Block, and GK Buildup. Circulation and Long Balls are related enough to these other 3 metrics that I’ll discuss them at different times but I don’t feel a need to dedicate entire sections to them.
Decrease of the High Press
The all-action, rock-and-roll, chick-with-its-head-cut-off Red Bull-style press saw its heyday in the mid-2010’s. Since then, we’ve seen an evolution from a fairly mindless press to a much more methodical, structured, and systematic pressing style. Hell, even RB Leipzig has seen decreasing scores in this metric, from 99.8 percentile in 15/16 2. Bundesliga, 85.4 in 17/18 Bundesliga, and 24.3 in 23/24 Bundesliga.
These equate to raw PPDA values of 6.9 in 15/16, 9.8 in 17/18, and 13.6 in 23/24. And don’t just take my word for it, Wyscout’s numbers for these years are 5.4, 9.5, and 11.3 respectively. These still rank them amongst the highest pressing sides in their league each season, but the raw numbers have increased (which means less intense pressure, as a lower PPDA value indicates fewer passes allowed per defensive action).
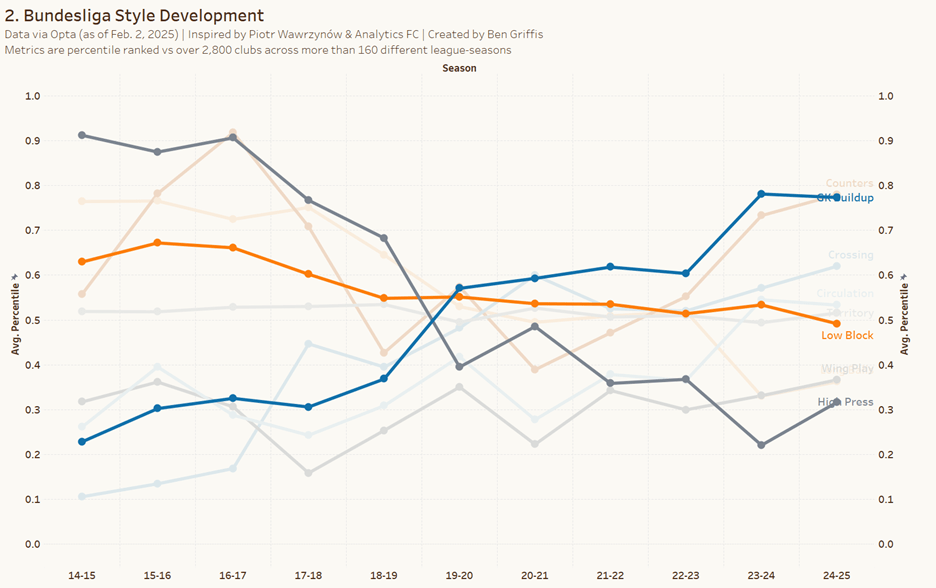
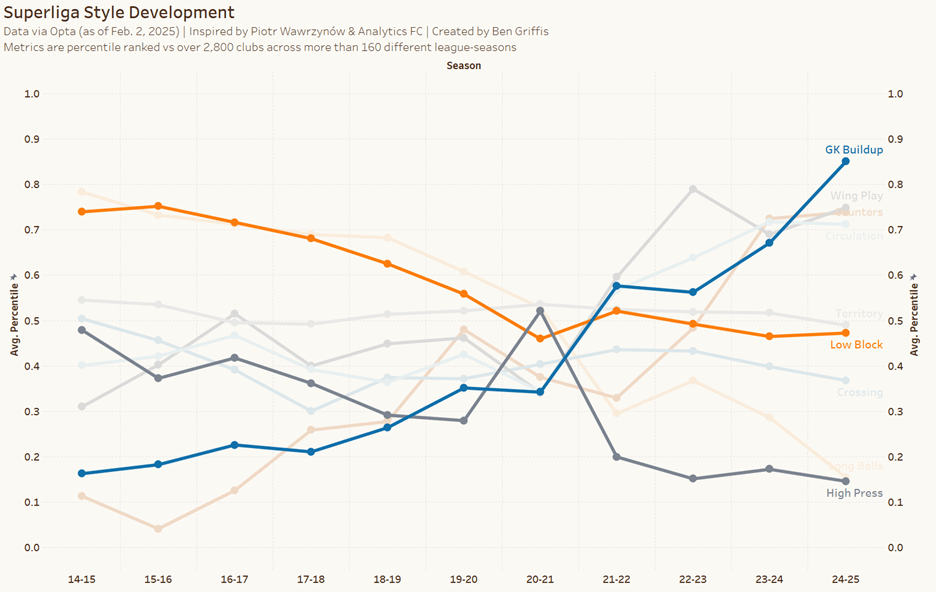
Below is the Bundesliga and 2. Bundesliga’s style development from 14/15 through 24/25 (as of February 2nd, after Spieltag 20 in both league
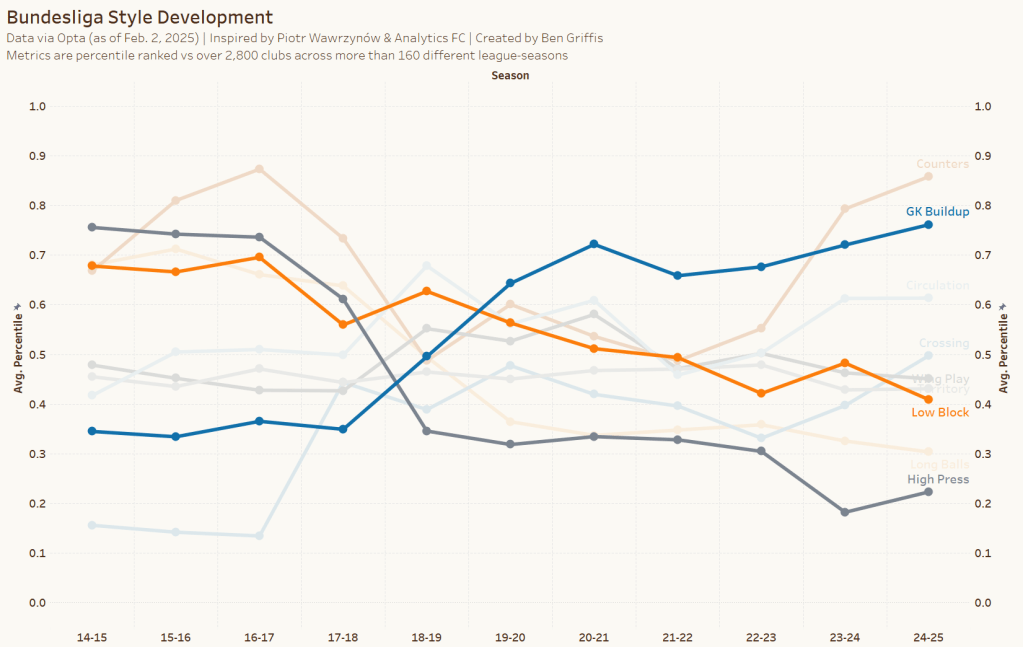
Germany is a known haven for pressing, famously being the home of RB Leipzig, Jürgen Klopp, and Alpine-Klopp Ralph Hasenhüttl teams. The fact that their leagues illustrate a decreasing High Press trend should drive this point home.
Adin Osmanbasic of Spielverlagerung wrote a great article in 2017 detailing different types of pressing. Man-oriented, zone-oriented, space-oriented… all different ways teams use (used?) pressing to harass and break up their opponents’ possessions. Jon Mackenzie’s article about Hybrid Pressing 6 years later shows further development in the tactics of pressing.
In my opinion, the lower PPDA values of the mid-2010s and the higher values of today are due in large part to the evolution of pressing I’ve talked about. Do some teams still press like headless chickens? Absolutely. Just go watch TSC Bačka Topola in Serbia this season.
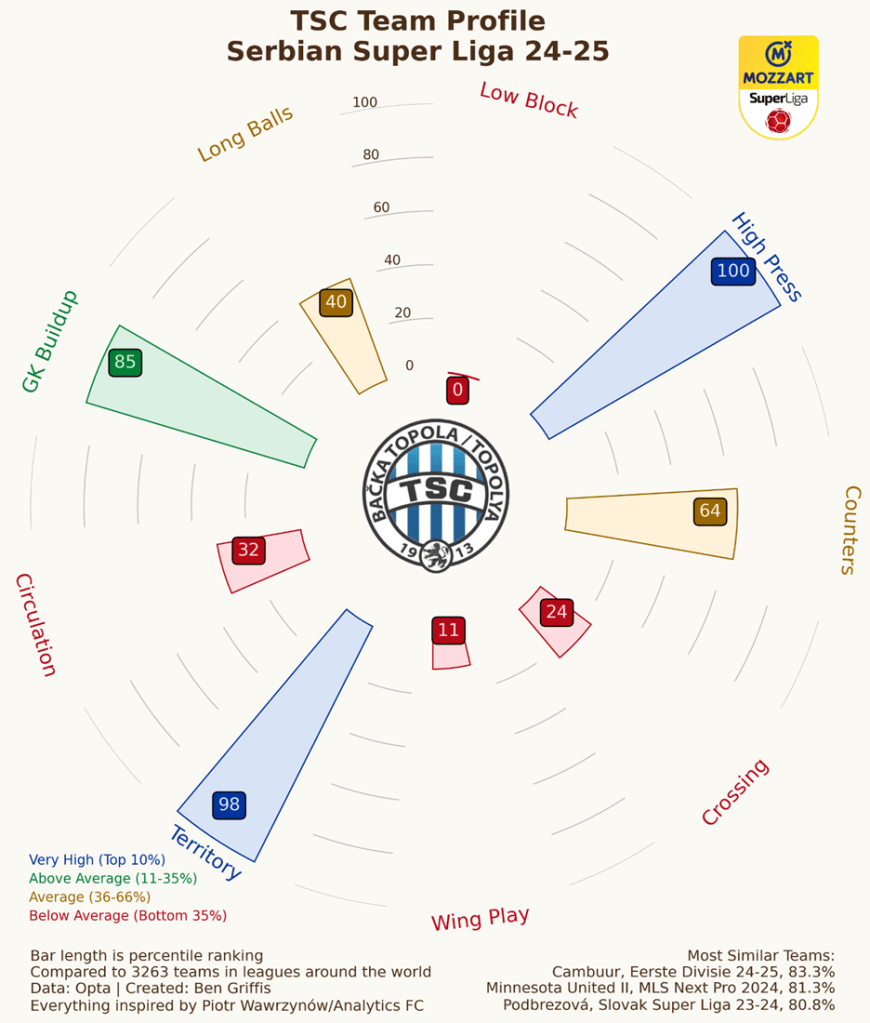
However, the advent of a more structured and even hybrid systems of pressing have likely led to a slightly less intense style of pressing. Fewer teams are sending their strikers and wingers out to sprint for 90 minutes, which when done poorly can open themselves up for a slaughtering (and exhaustion in a time where FIFA and continental confederations keep shoehorning games into an ever-cluttered schedule). More teams are setting up pressing tactics that respond to specific triggers, or aren’t pressing as high up, or are doing so more zonally, allowing opponents to have possession in specific areas of the pitch.
Further, there may also be two confounding factors involved: Circulation and Long Balls. The image below shows how connected High Press is with Long Balls, and also how Circulation is increasing at the same time these are decreasing. How are these related?
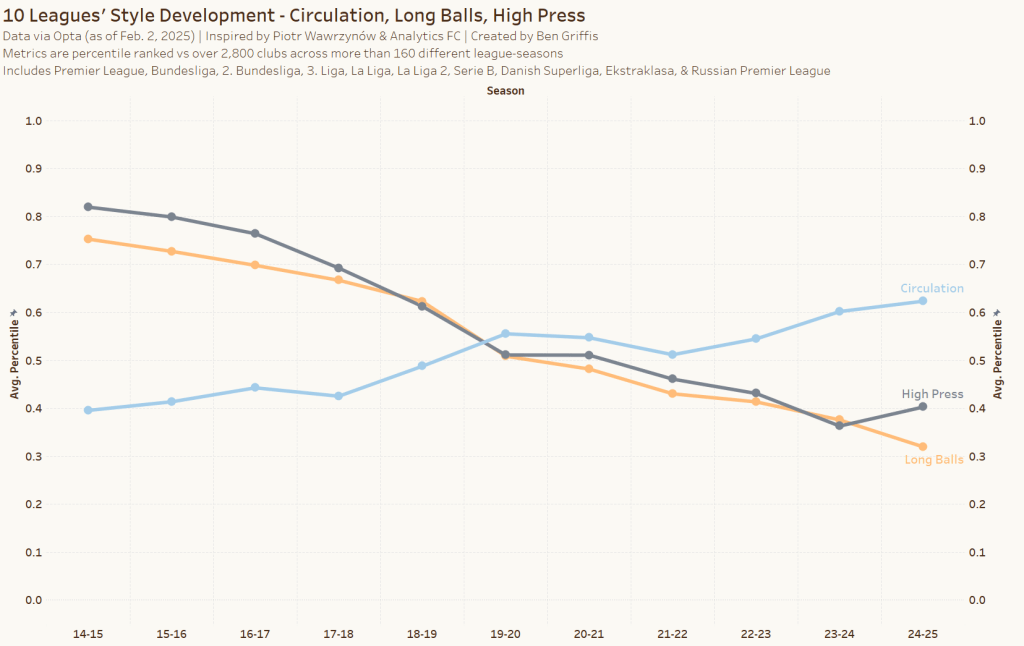
For starters, let’s look at an example of PPDA. If an opponent had 50 passes in their first 60% of the pitch, and a team made 7 defensive actions in this area, their PPDA is 7.14. If the opponent instead made 75 passes, then PPDA is 10.7. This scenario could happen if teams started playing “safe” passes early in possession sequences than they once did. And this appears to have happened around Europe over the past decade, as we can see with the increase in Circulation.
An increasing Circulation metric tells us that teams are passing laterally as a higher proportion of their passes in the buildup zone now than 10 years ago. Naturally, lateral passes (often between center backs or deeper midfielders) are completed at higher rates than vertical passes, regardless of if those forward passes are long boots to a striker or a line-breaking pass to a midfielder. Thus, a team might have more passes in the same amount of time or number of defensive events in 2025 than in 2015. This would slowly increase PPDA.
Relatedly, Long Balls have decreased at virtually the same rate as High Press. I don’t want to get into a chicken or egg scenario, but think about a simple example flow of passes and pressure. The team in possession has the ball with their RCB, and the defending team rushes to press them. The RCB passes to the LCB and the striker curves their run, pressing the LCB but blocking the lane back to the RCB. Further, it’s 2014 so teams are not passing back to their goalkeeper as often as they are today. So, the LCB passes to the left back, who is pressed by the defending right winger. The defending attacking midfielder is tightly marking the possession team’s defensive midfielder. Given this situation, the left back boots it long.
This scenario can of course happen today, and it happens regularly. However, a lot of teams will try to avoid these aimless boots out of pressure (for better or for worse), and instead pass back to the goalkeeper, or have center backs a bit more mobile and active, dropping back to open their passing lane. Even if the goalkeeper or center back boots it long, there’s still an extra pass or two than in 2015. If the defensive action in the event data was an interception of the long pass, the PPDA is increased just by trying to play out of the pressure and not boot it long too quickly.
Further, more and more teams are playing out from the back at all levels of football than a decade ago. Regardless of if they are being pressed or not, having a long pass up to the attackers within the first one or two passes is getting rarer. This is backed up by our data.
Both of these factors, increasing Circulation and decreasing Long Balls, will form a feedback loop with High Press. I’m not going to examine if there’s a causal relationship here, but the decade-long data for these certainly inform each other.
Decreasing Low Block – i.e. Higher Defensive Lines
The second key interesting evolution for me is the decreasing Low Block metric, or rather, the average height of defensive actions appears to be moving further up the pitch. This would indicate higher defensive lines around Europe. Obviously, teams still play very deep blocks. And not all teams are using an Ange Postecoglou-style without-Micky-Van-de-Ven-we-lose-100%-of-our-games line at midfield either. But the average height seems to have increased.
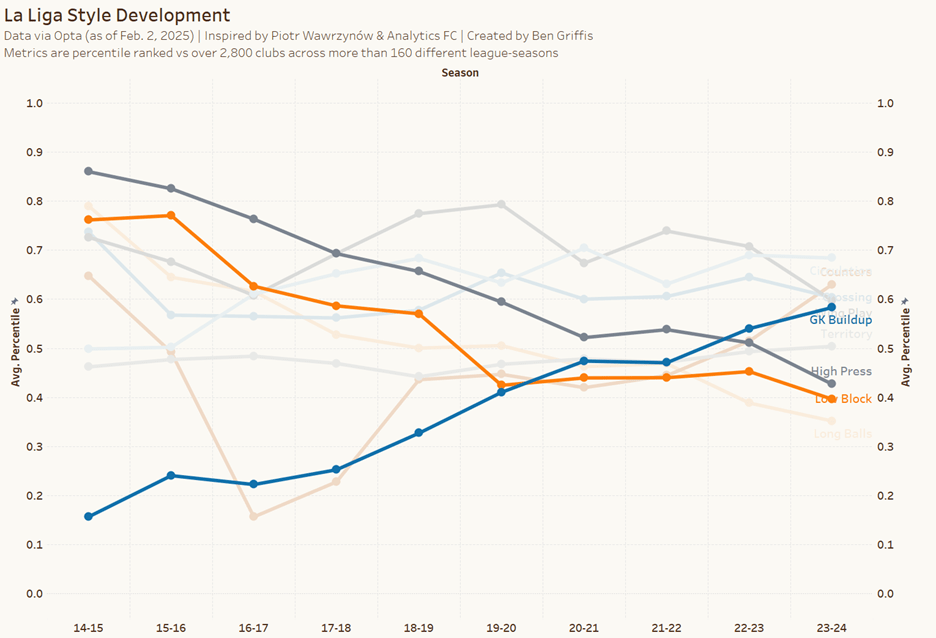
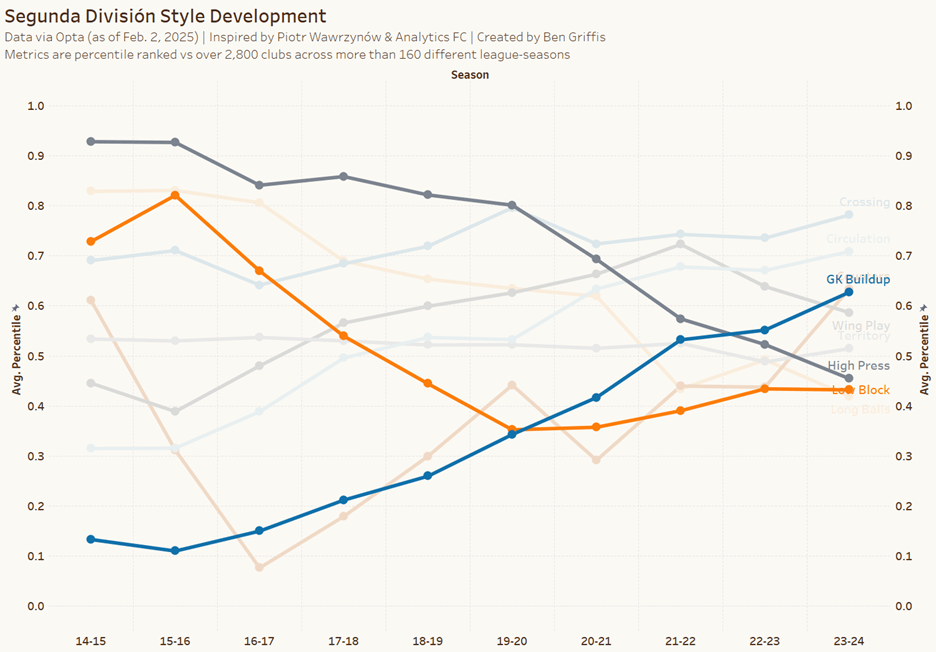
Take, for example, Spain’s development in these metrics. In both La Liga and Segunda División, we see a fairly steep decrease in the Low Block metric through 19/20 and then it’s relatively stable up through 23/24.
We can even dive further into this. The image below plots the lowest and highest line heights in Spain for each season. Even the lowest blocks in Spain have moved further up the pitch over the last decade, from the lowest block in 14/15 (39.2, Barcelona B in Segunda) to the lowest in 23/24 (41.7, Cartagena in Segunda). La Liga’s lows went from 39.3 in 14/15 to 42.0 in 23/24 for reference.
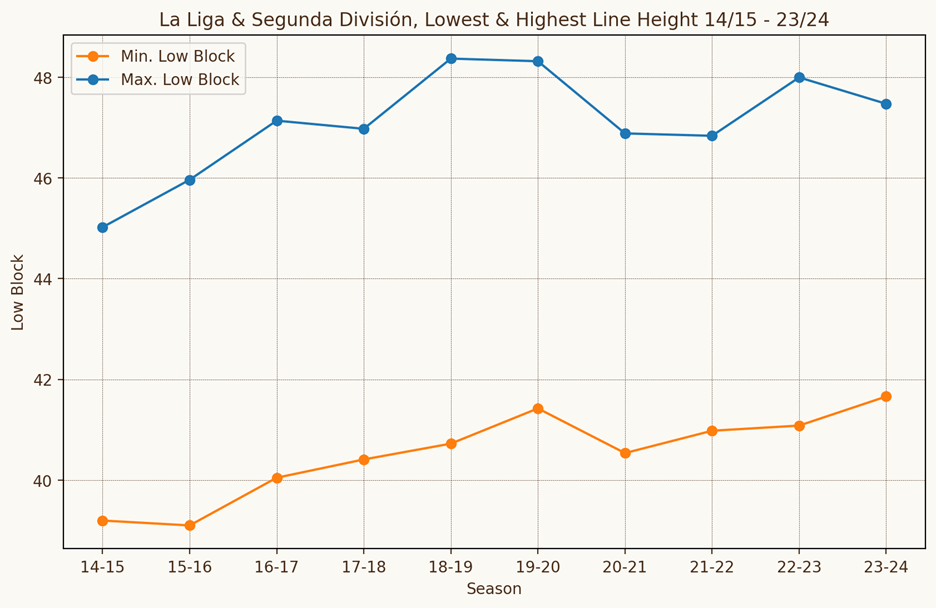
At the same time, the highest blocks each season also increased. Not as steadily as the lowest blocks, but the highest block in 14/15 was Barcelona in La Liga at 45.0, and then in 23/24 it was Athletic Club in La Liga at 47.5.
Overall, from 14/15 to 23/24, the highest blocks moved up the pitch by 5.6%, and the lowest blocks by 6.4%. So, not only has the average height of defensive actions increased, but the average height of both the lowest and highest lines have increased at similar rates to each other.
And just like with High Press, there’s another variable I’d like to bring into the mix that is likely related to this decreasing use of low blocks: Long Balls.
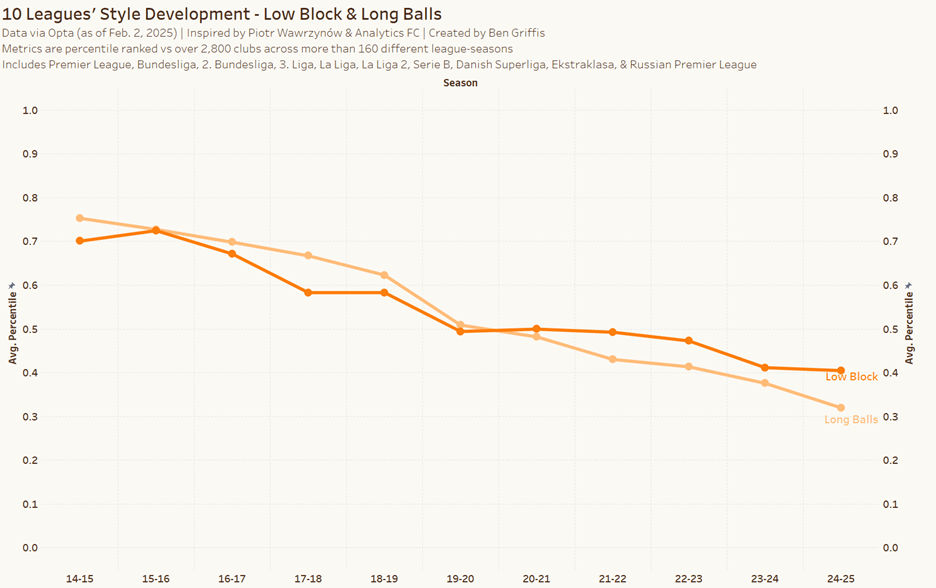
The two metrics track each other very well, and thus High Press also follows Long Balls too. The way I interpret this is that as defenders creep up the pitch, there’s less space for them to boot long balls. And as they are less likely to be recovering possession in the defensive 25% of the pitch (which is where my long ball metric looks at), there are fewer passes from those areas. We’ve already discussed the increasing Circulation and touched on increasing GK Buildup (thus, lateral and short passes from the GK), which further decrease the number of long passes a team plays. While the Long Ball metric only considers passes from x = 0 to x = 25, it’s reasonable to assume that, given our wide-spanning data, teams are probably playing fewer long balls in other areas of the pitch as well.
In addition to that, if teams are in fact either a) pressing less intensely or not as high up the pitch or b) pressing in a more methodical or hybrid manner, then it’s natural to come to the conclusion that football is possibly more compact today then it was 10 years ago. Passes would naturally be shorter as a result, even if only by a few meters. But this would limit the number of long passes teams play, by an arbitrary and static threshold of, for example 25 meters defining what a “long” pass is.
If a team’s out of possession x-axis in 2014 ranged from 39 to 70, and in 2024 it was 42 to 65 (rough numbers obviously), there will be a shorter average pass length to begin with, coupled with teams obviously opting for safer and/or more lateral passes as well that we’ve seen in other data so far.
However, as is the case with both football and multi-league averages, not every league will exhibit the same trends. This is the case with the Polish Ekstraklasa’s lowest and highest line height from 17/18 through today.
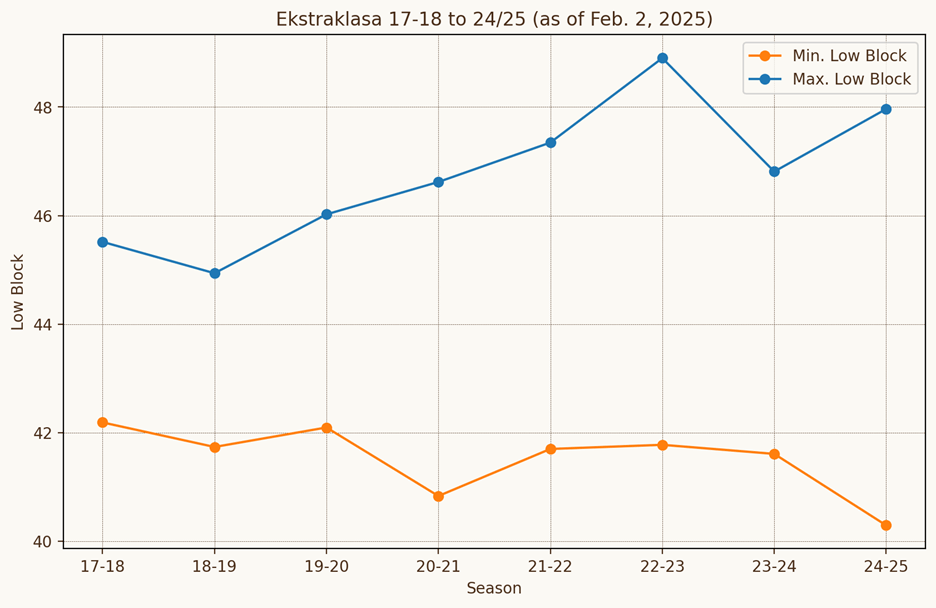
Górnik Zabrze’s current average line height of 40.3 in 24/25 is a bit lower than Cracovia’s height of 42.2 in 17/18. Even if we exclude the in-progress 24/25 season, the lowest line heights in 23/24 (Górnik Zabrze, 41.6) and 21/22 (Stal Mielec, 41.7) were lower than any of 17/18, 18/19, or 19/20. 20/21’s Zagłębie Lubin at 40.8 is a notable outlier in the 17/18 to 23/24 trend.
At the same time, Ekstraklasa does exhibit the increasing highest line height that we saw in Spain (and that happens in Germany, Russia, Sweden, Norway, etc.) with Lech Poznań’s 45.5 in 17/18 growing to Raków Częstochowa’s 48.9 in 22/23, with Lech Poznań leading the league so far in 24/25 with 48.0.
This does not, however, mean that Ekstraklasa’s Low Block average percentiles have stayed constant or even increased since 17/18. Don’t fret, the league-wide trend still follows the wider European trend we see aggregated across other leagues.
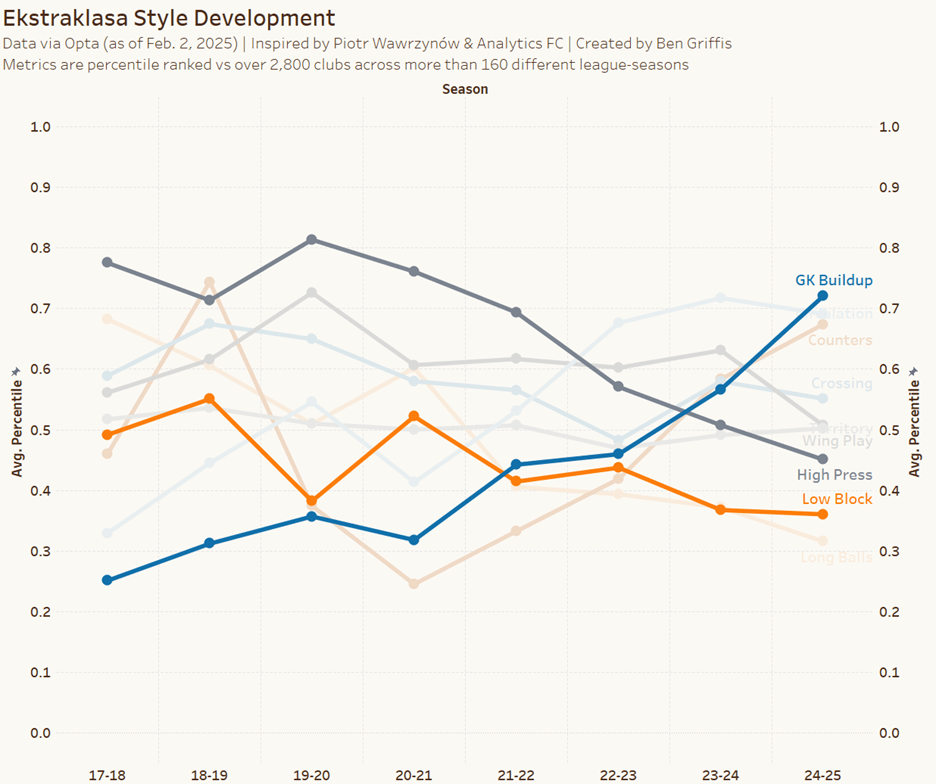
Basically, this means that while most teams are moving their lines higher up the pitch, the lowest blocks have stayed fairly consistent. The Low Block trend in Poland hasn’t dropped as much as it has in Spain, but it has still decreased.
Increased GK Buildup
I saved the best for last! Or rather, I saved the trend that’s my favorite for last. And further still, I saved the trend that makes pundits scoff for last. Yes, we’ve arrived at the English Football Pundit’s favorite thing to shit on; goalkeepers playing passes or even (look away now if you’re a “back in the day we were allowed to two-foot the opponent, drink beers at halftime, and celebrate goals when they happened” football fan) be a sort of playmaker from the back!
Across the world, goalkeepers have begun being more involved in first phase possession than they ever have been. It’s important to note that this metric isn’t capturing a Manuel Neuer-style “sweeper keeper” tactic. Sweeper keeping is a defensive, out of possession tactic while the presence of/how goalkeepers are involved in buildup is an in-possession tactic. You can have goalkeepers who literally push up into the center circle in possession but aren’t necessarily aggressive sweeper keepers, just watch Dominik Reimann at Magdeburg under Christian Titz.
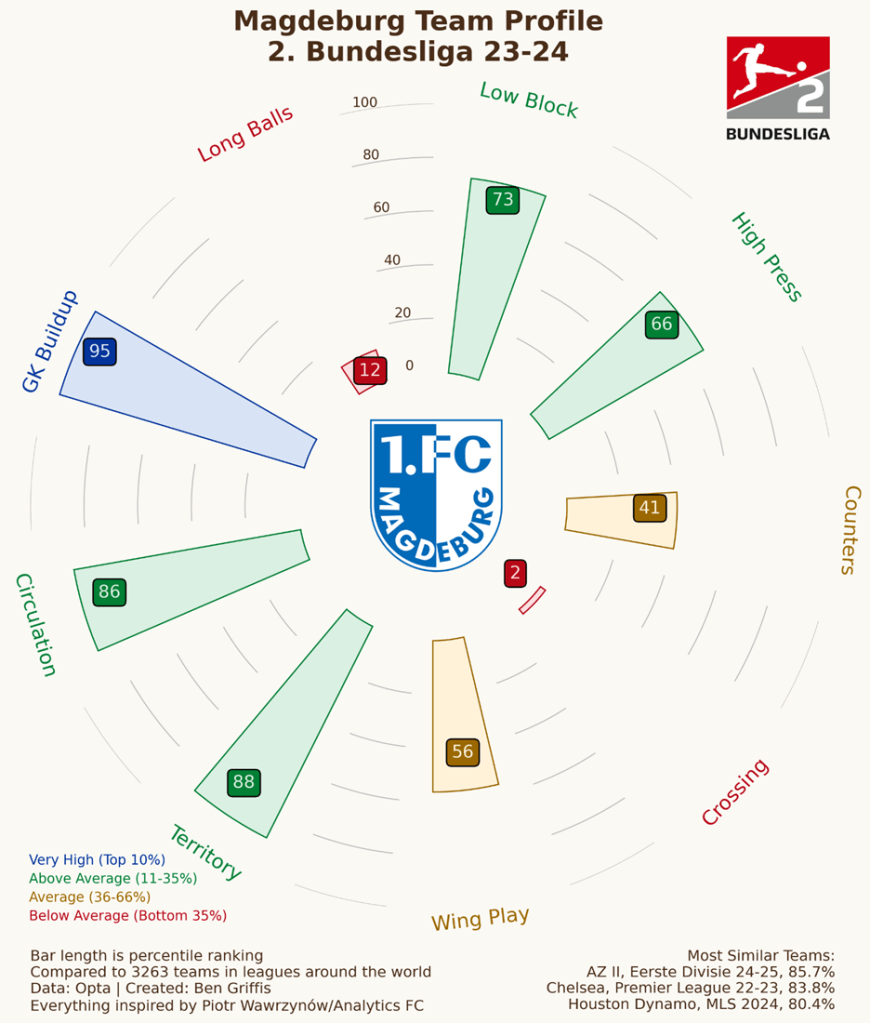
Magdeburg in 23/24 had a 95th percentile GK Buildup score and still a 73rd percentile Low Block score, the 6th-lowest block in the league that year (of 18 teams). While it is easy to call any keeper who is seen in the middle third a sweeper keeper, we owe it to ourselves to understand that they are totally separate concepts.
While Christian Titz and Tim Walter (formerly of HSV and Hull City) might be the poster managers of an aggressive GK buildup tactic, the Danish Superliga is possibly the best league to illustrate the fairly recent trend of goalkeepers being much more involved in buildup and being instructed to play a shorter passing game to retain possession.
The Superliga has gone from an average GK Buildup percentile of 17.6 in 14/15 to a whopping 86.1 as of the Winter break in 24/25. The league includes teams like Nordsjælland, Brøndby, and AGF who all recorded 90th percentile or higher scores in 24/25 so far (Nordsjælland this season have the 6th-highest GK Buildup score in my sample of 3,263 team-seasons!).
With that said, the Finnish top-flight Veikkausliiga’s 2024 season is possibly the league with the most constant and consistent GK Buildup score, with 7 of their 12 teams recording scores of 90th percentile or above and only a single team (KuPS) with a score below the 75th percentile. An honorable mention goes out to MLS Next Pro 2024, whose data I have through August, where 22 of 29 teams recorded 90th percentile or higher scores. Another league from the US, USL League One, as well as Australia’s A-League are both slightly above Veikkausliiga’s average GK Buildup percentiles too.
Even though German teams have been thought of as a bastion of modern GK tactics, they are not as consistently high on this metric as other leagues. Compare these with the Superliga’s percentiles: Bundesliga has gone from 36.3 in 14/15 to 77.5 in 24/25, while 2. Bundesliga has gone from 24.5 to 78.7 respectively. They have both started higher and ended lower than the Superliga in the same timeframe. This isn’t to say that tactics involving the GK in buildup aren’t happening in Germany, but merely to illustrate how much Danish teams have bought into the idea.
And just like with out other key variables of interest, there are other metrics with which GK Buildup will likely have mutual influence: Long Balls and Circulation.

Of course, given my definition of long balls only considers passes from the first 2% of the pitch and goalkeepers are a large part of those passes, keepers shifting to a shorter and more lateral passing style will impact the Long Ball metric. If they opt to pass it short to a center back or even push up past the 25% line of the pitch to pass instead of just playing it long from deep, this will impact the Long Ball metric. I hesitate to claim causality without a statistical test, so I can’t claim if goalkeepers being asked to be more involved in buildup is a cause of managers’ relative aversion to long balls nowadays, or if long balls have decreased because goalkeepers have been passing it shorter and more laterally. But they are obviously related to each other.
Further, Circulation has slowly increased over time as well. As I’ve said several times throughout this article, the increase in this metric helps us understand that passing tactics have become a little more lateral and a little less “risky” in early phases of possession. Teams still play vertical passes, players are getting better and better at completing line-breaking passes, and long balls and switches are still played every game by every team. However, most teams seem to prize possession a little more than they did 10 years ago, or rather, they might be trying to use their passing differently. Perhaps to “defend with the ball”, or maybe some lateral passes around the back to shift the defense to one side before pinging a long switch to the now-open far-side winger.
Goalkeepers being more involved in buildup and even at times (but not for all teams with high GK Buildup scores) being in the middle third playing lateral passes would increase a team’s Circulation score. And again, on causality, we may not know if goalkeepers are doing this because managers want to circulate the ball more or if increased circulation is a result of goalkeepers being asked to change their passing style, but we can see how they are linked.
Final Words
Football tactics are never static, and over the past decade we’ve seen changes in so many aspects of the game. Using general playstyle data, the most interesting to me have been a major shift in the passing style of goalkeepers and their importance to a team’s buildup, a decrease in pressing intensity likely due to a one-two punch of shifts in how pressing systems are constructed and changes in preferred passing tactics within teams at the same time, and the ever-increasing average height of defensive lines.
While I used 10 leagues from European competitions over the past decade, I think that we can feel relatively confident in generalizing these findings to the wider elite footballing world.
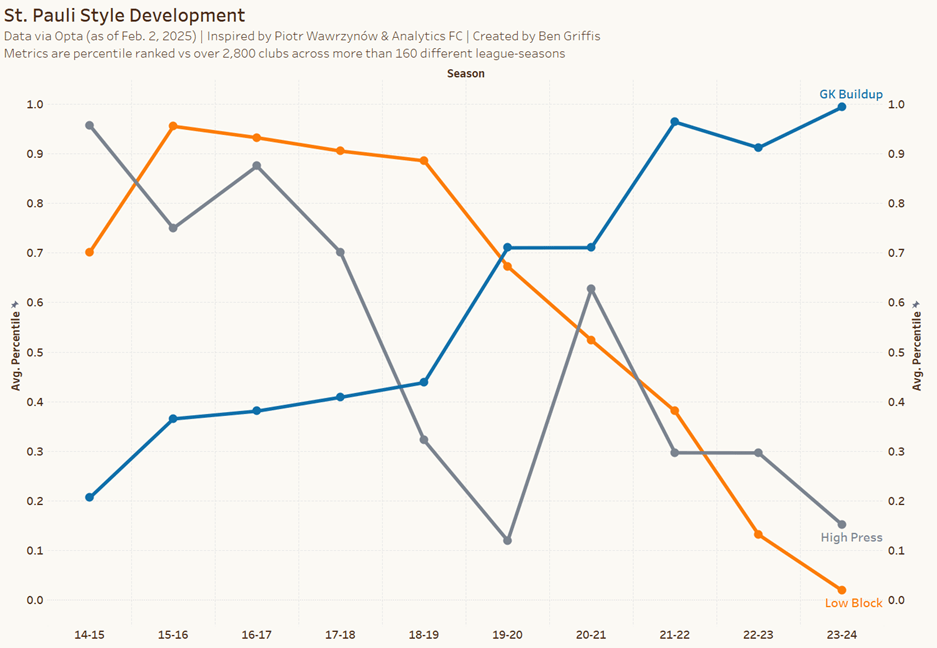
I’ll leave you with a club whose last decade perfectly embodies the changes we’ve seen in the data today: St. Pauli’s 2. Bundesliga campaign from 14/15 through 23/24. The Kiezkicker have had 7 managers within this timeframe, yet have still shown a large decrease in both High Press and Low Block as well as a huge increase in GK Buildup.
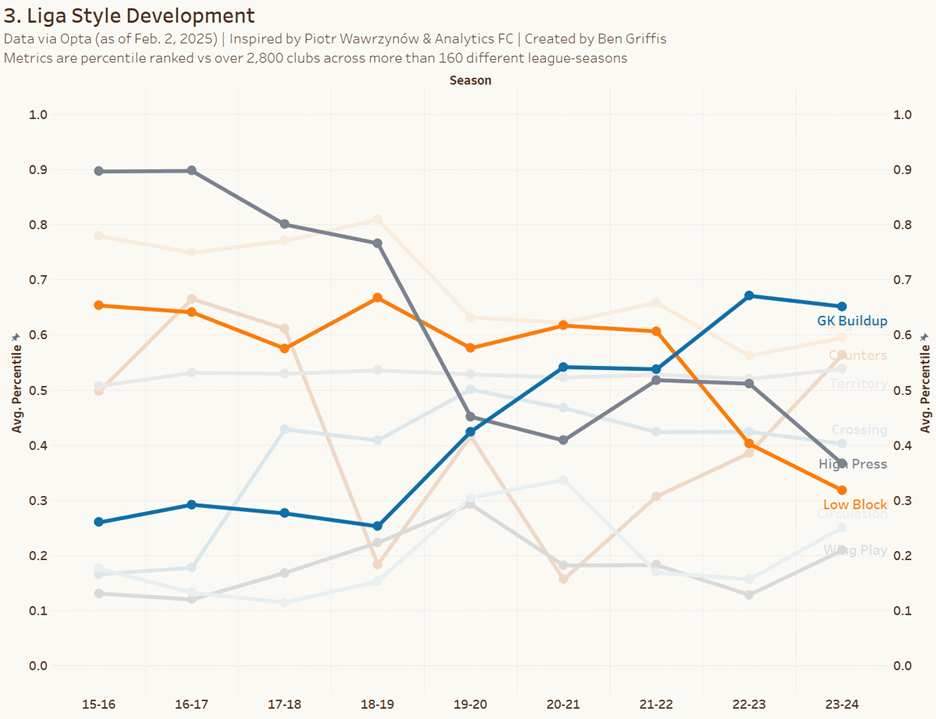
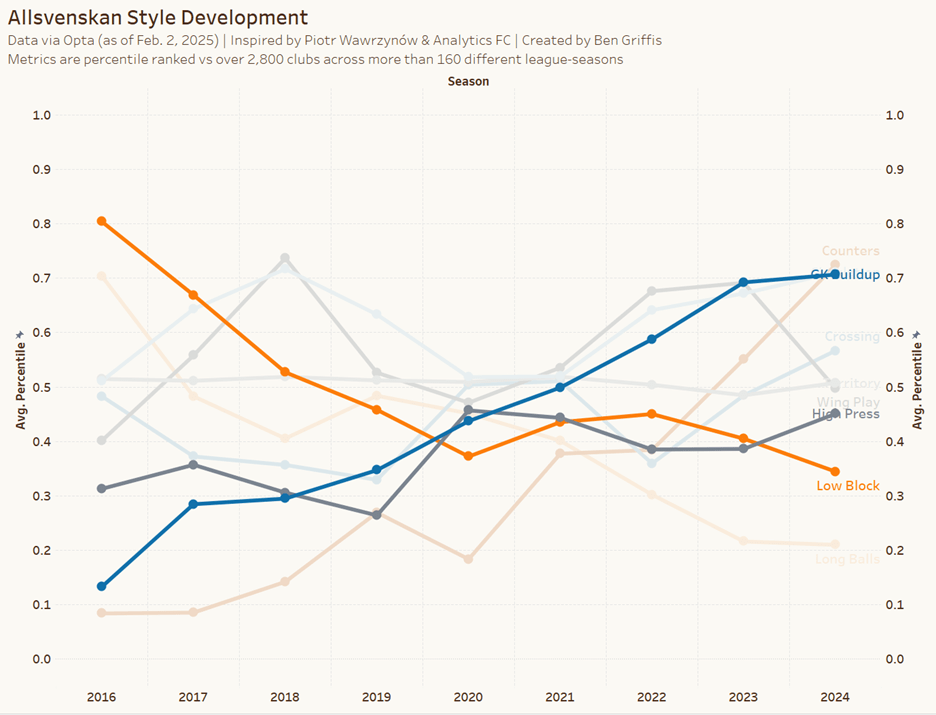
Appendix: Extra Graphs
Below are the leagues included in my decade-long data that I have not specifically shared yet: Russian Premier League, German 3. Liga, Swedish Allsvenskan, and Norwegian Eliteserien, all with the 3 key metrics of interest highlighted.